想象一下,你对你的嵌入式系统正在做的事情有充分的了解,而不以任何方式影响其实时性能,沿途创建每个步骤的记录。你可以确定你的应用程序的性能和覆盖数据,以认证你的安全关键应用程序。您可以比以往更快、更可靠地将您的嵌入式设计推向市场,同时创造一个更安全、更稳定的产品。这就是基于跟踪的调试给您带来的好处。
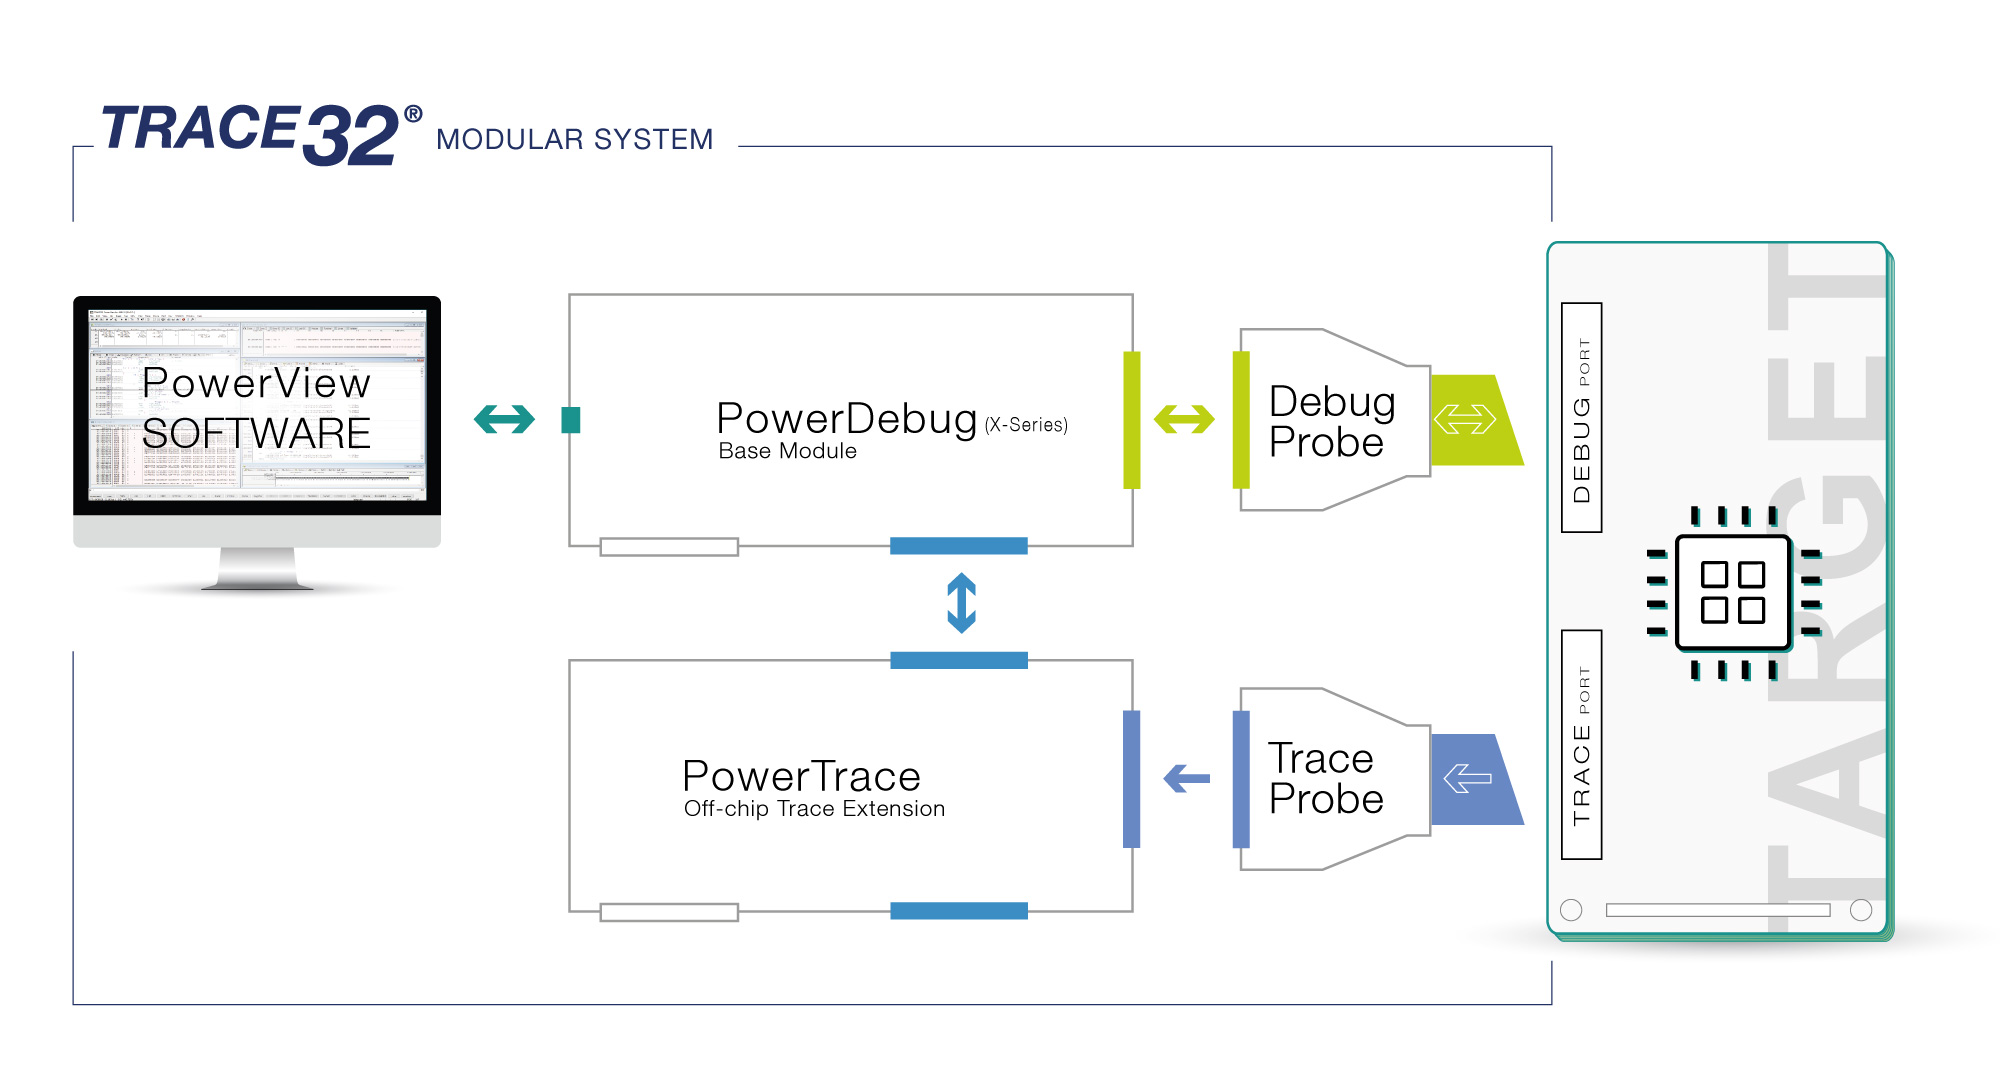
Lauterbach 的 PowerTrace 扩展选择在被测系统正常运行时不间断地收集信息。您可以使用调试时熟悉的TRACE32 PowerView 图形用户界面,立即开始检查被翻译和显示的数据。此外,您还可以使用劳特巴赫TRACE32 工具中的所有控制和脚本操作。
传统的调试就像在汽车飞驰而过时拍摄汽车比赛的快照:你会错过比赛中发生的大部分情况。基于跟踪的调试就像访问汽车的车载遥测技术、赛道条件和驾驶员的动作。每个动作及其时间都被记录下来。
由我们的PowerTrace扩展提供的程序流数据可以准确地告诉你哪些指令被执行了,以及执行这些指令用了多长时间。通过使用实时跟踪,你可以:
许多嵌入式处理器能够提供关于正在执行的软件的这种级别的细节,而不干扰正在测试的应用程序。你所需要的是正确的工具来收集任何可用的信息并对其进行分析:我们的PowerTrace。
利用劳特巴赫40多年来在捕获和分析跟踪数据方面的可靠经验。持续的改进,以及密切的行业联系,使得劳特巴赫能够为嵌入式行业创造最好的可用工具。无论你的情况如何,TRACE32®工具已经被优化以满足你的需求。
记录那些 "百万分之一 "的事件并发现它们发生的原因。通过将跟踪数据流传到你的本地PC,提供几乎无限的样本长度,保存超长期的测试数据(几小时、几天甚至几周的运行时间)。
同时检查以下任何或所有内容:hypervisor ;所有客户操作系统,包括其设备驱动程序、中断服务例程和中间件;以及在任何或所有内核上运行的应用软件。
使用单个跟踪工具,通过同一跟踪端口同时记录来自多个内核的跟踪信息,使用异质或同质处理器的混合架构 。
缓冲区大小高达8GB,跟踪端口带宽高达100GBit/s,绝不会错过任何时刻。PowerTrace为你提供了最快的跟踪工具,支持当今最多跟踪协议。
Trace information can be stored in special on-chip memory buffers or spooled off-chip to be collected by dedicated trace tools. On-Chip memory buffers are located inside the chip and are made from fast, but expensive, on-chip memory, limiting their size to a few kilobytes. Off-chip trace interfaces allow for external tools with very large buffers (typically many Gigabytes) to collect the trace information. Of course, TRACE32 supports both off-chip and on-chip trace.
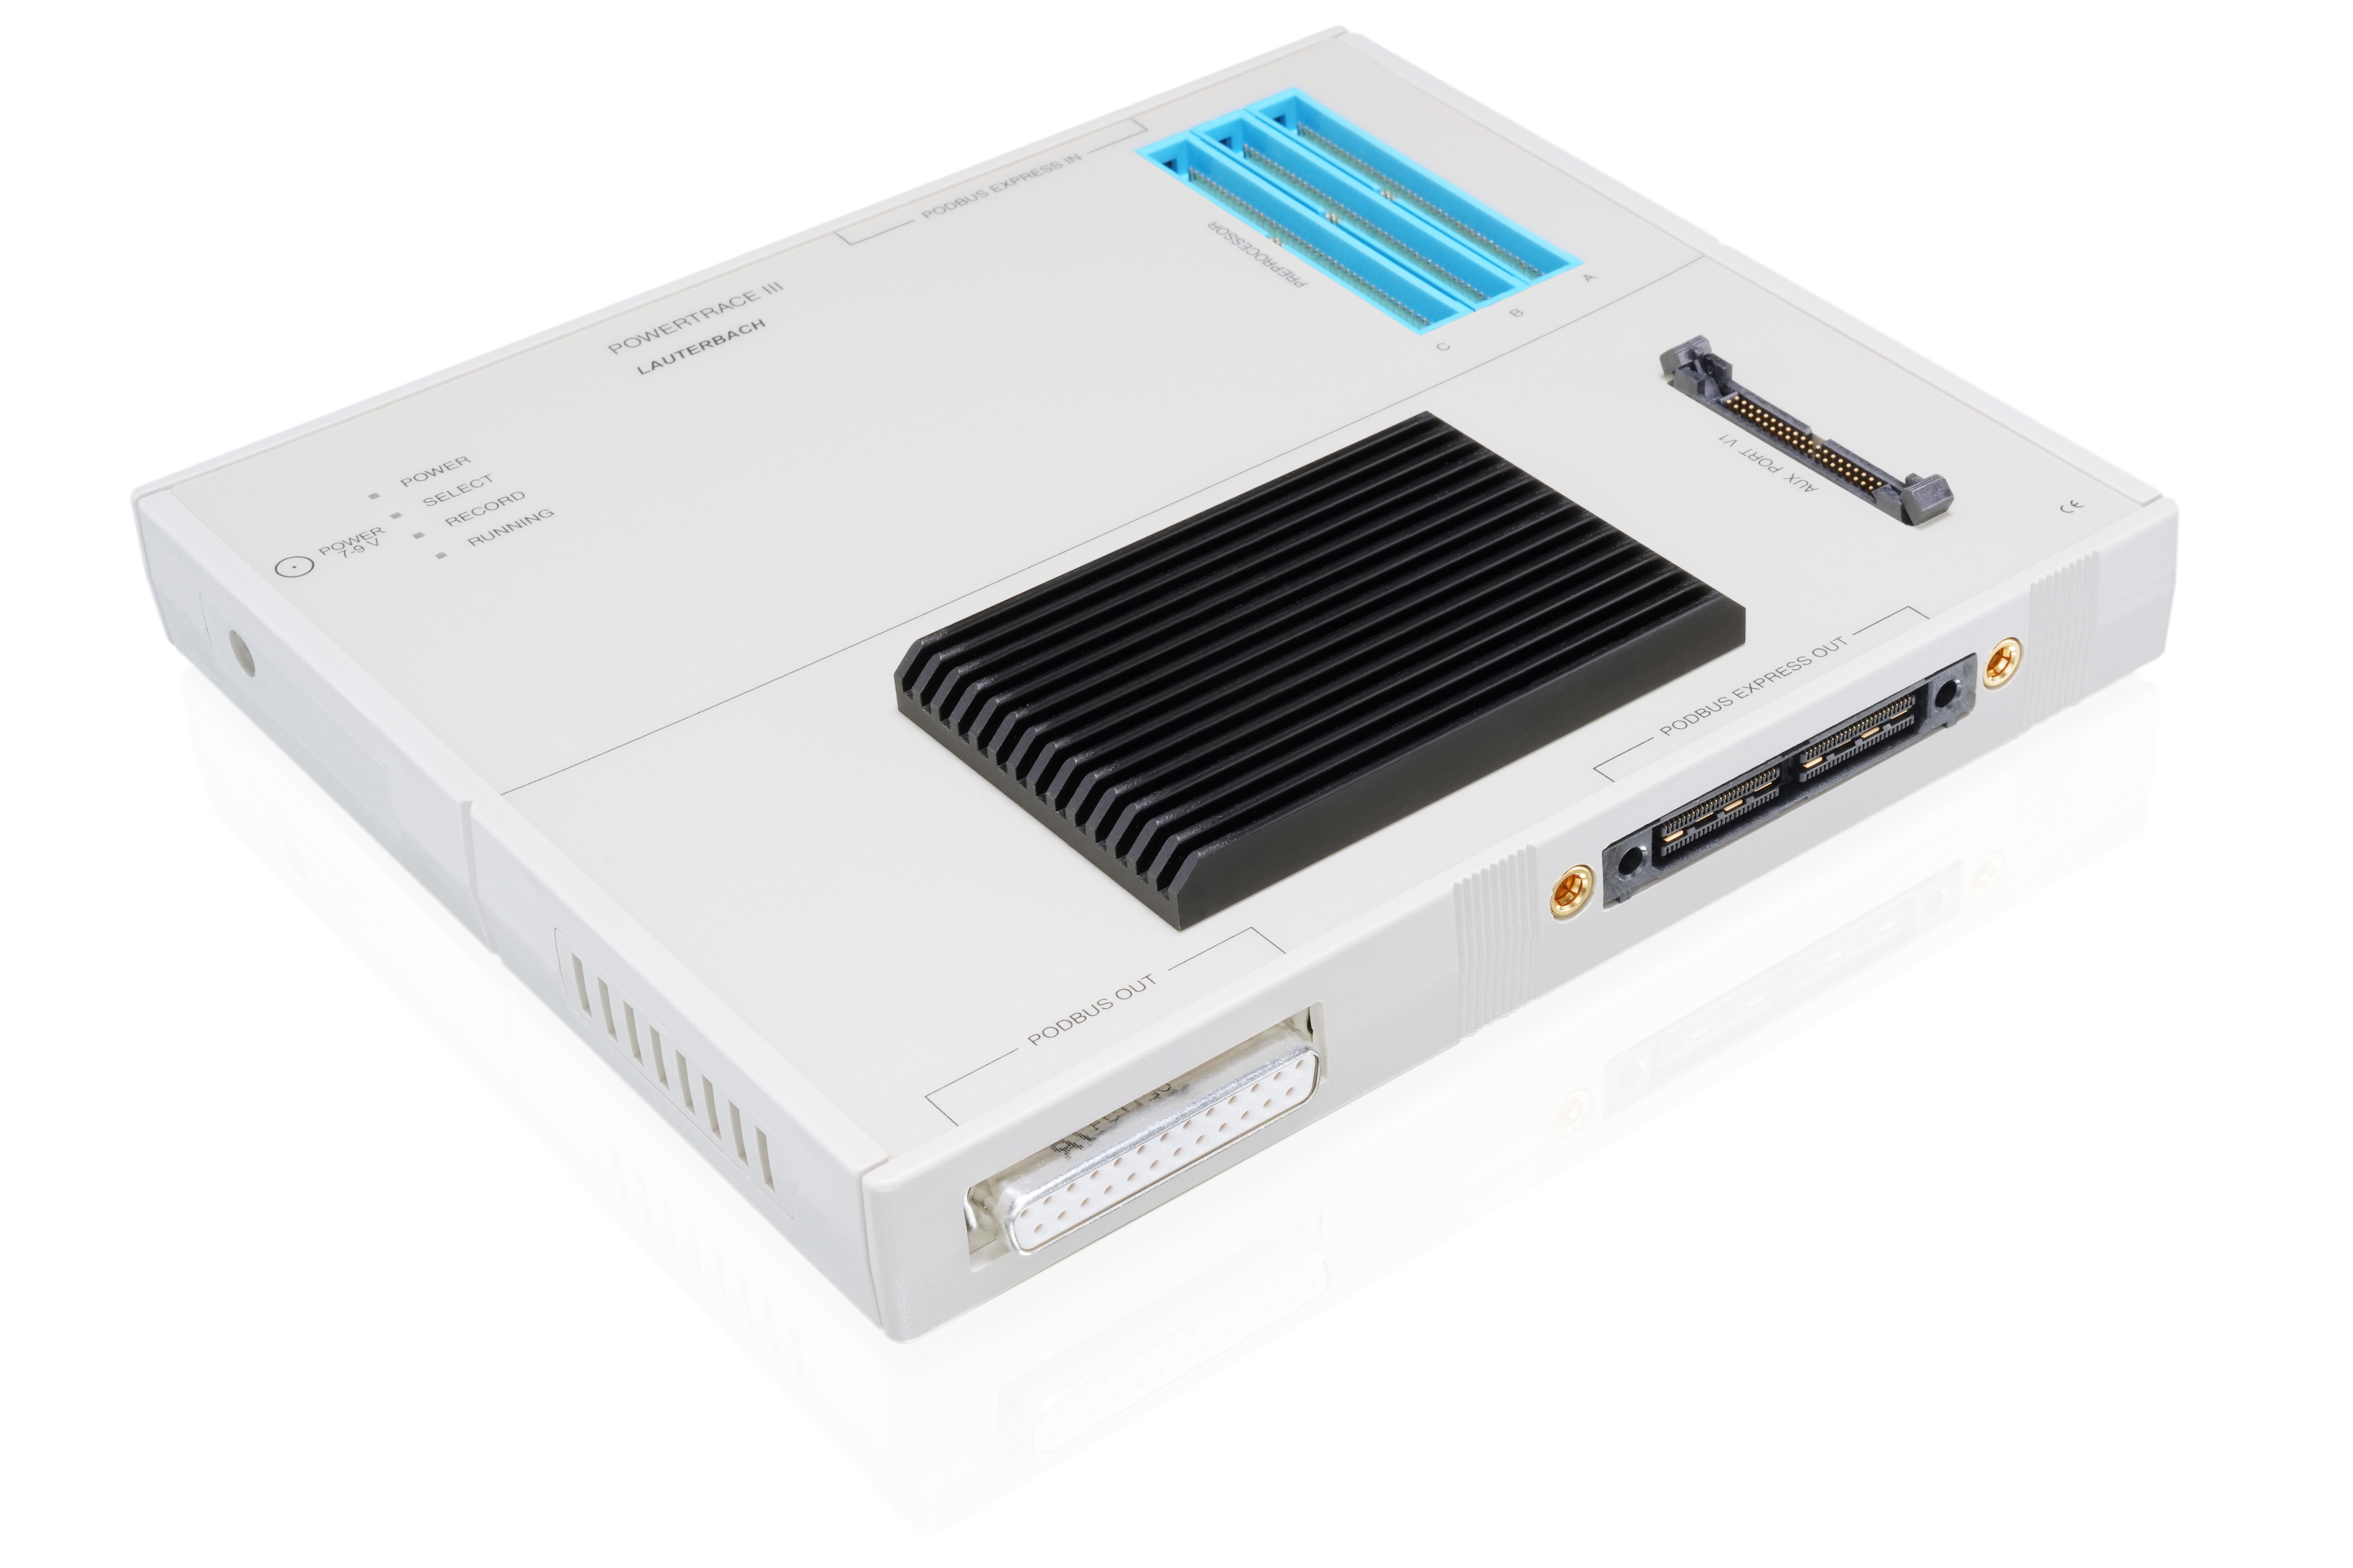
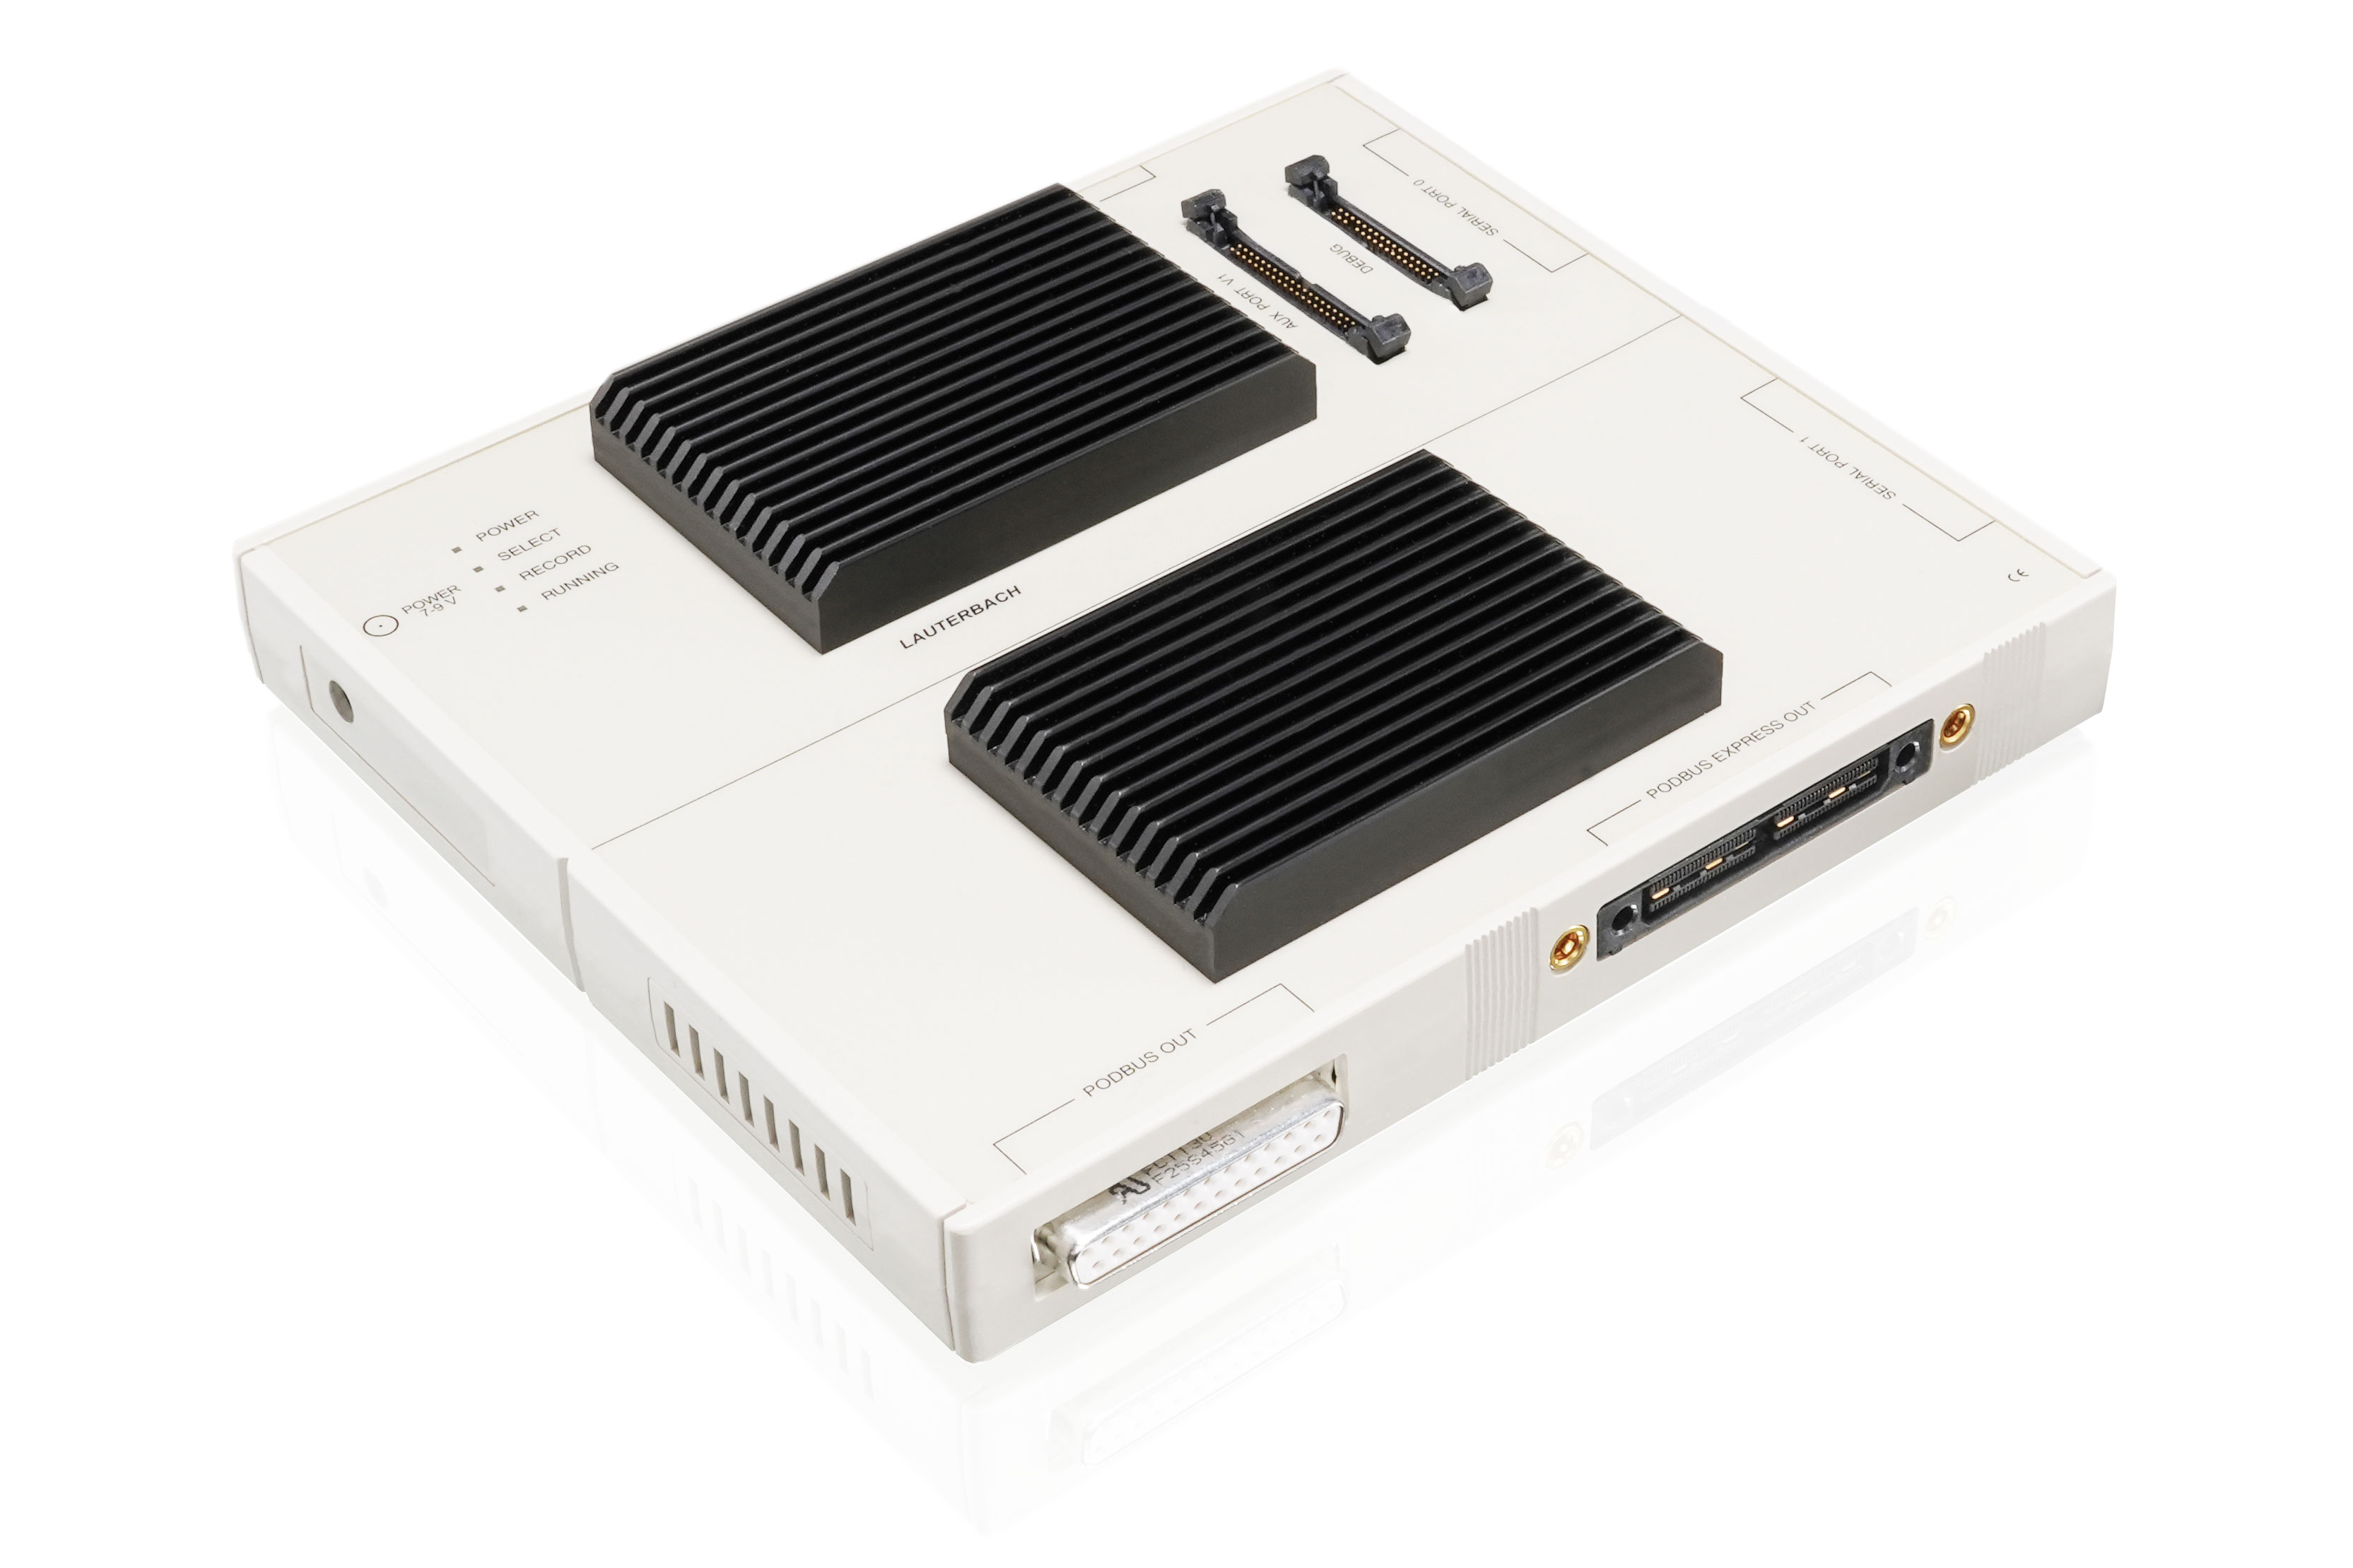
The PowerTrace extensions are part of our modular TRACE32 PowerDebug System. PowerTraces connect to the side of your PowerDebug X51 module, which provides the connection to your host PC either via USB 3 or Gigabit Ethernet. The older PowerDebug PRO and PowerDebug II will also benefit from a PowerTrace extension.
Similar to the debug probe plugged to the PowerDebug X51, you need a platform-specific connecting device between your PowerTrace and your target’s trace port – because trace ports come in all shapes and sizes. That connecting device is either a trace probe (aka. trace preprocessor) or – with PowerTrace Serial – it could be just a flex-cable or passive trace adapter.
如果目标板上有用于调试和跟踪的组合连接器,则可以将Debug Probe 连接到劳特巴赫跟踪硬件,通过跟踪连接传递调试信号。
芯片的传输技术将决定我们各种 PowerTrace 模块类别(并行或串行跟踪)的最佳匹配。两者都是为满足您的最高性能要求而设计的,能够管理当前和未来的吞吐量。劳特巴赫提供业界领先、最先进、适应性强的工具,支持嵌入式设备发出的几乎所有传输技术和数据格式。
对于低速 CPU 或Arm Cortex-M 内核,我们提供了两种结构紧凑、经济高效的调试和跟踪替代方案,即CombiProbe 和 µTrace 模块。
嵌入式设备发出的跟踪数据遵循一定的编码格式,或称跟踪协议。TRACE32 ,它能理解各种标准和专有的跟踪协议,用于系统级和程序流跟踪。下面是对TRACE32 支持的最常见协议的介绍。
嵌入式跟踪宏单元(ETM)提供程序流和数据访问的实时跟踪。它主要用于Arm 处理器,也可用于 Hexagon、Ceva-X 和 Teak 内核。
目前有4个版本:ETMv1、ETMv3、PFT和ETMv4。
The MIPI Trace Wrapper Protocol (TWP) was designed to combine the trace streams of multiple CPU cores to send them off-chip in a single trace stream. While it was originally designed for Arm's CoreSight debug and trace infrastructure it allows today the simulations tracing of Arm Cortex (ETM), Xtensa (TRAX), ARC (RTT) and many other architectures. Also, further trace sources like ITM/STM are supported.
Nexus trace(或IEEE-ISTO 5001)提供程序流、数据访问和总线活动的实时跟踪。它适用于PowerPC、ARC(RTT)、Xtensa(TRAX)、RH850和RISC-V。
多年来,劳特巴赫一直是定义和塑造Nexus标准的主要贡献者。
The System Trace Protocol (STP) is designed to analyze the dynamic behaviour of a real-time application on a higher level. System trace messages are either generated by an instrumentation in the software running on a processor or by components monitoring activities outside the processor. STP can support multiple trace streams and emit them directly via an off-chip port or STP can be wrapped in another protocol (TWP). Arm’s System Trace Macrocell (STM) implements such a system trace.
Tessent嵌入式分析提供了一整套用于多种用途的硅IP,包括用于监测所有主要CPU的IP。它还被用来收集RISC-V内核的实时跟踪信息。
跟踪可通过 USB、Aurora 协议导出,也可嵌入Arm CoreSight 跟踪中。
The Multi-Core Debug Solution (MCDS) is an on-chip trigger and trace solution from Infineon, often found in TriCore devices. Trace data can be stored on-chip or exported off-chip using the Aurora Gigabit Trace protocol (AGBT) or DAP streaming.
我们劳特巴赫有限公司在我们的网站上使用 cookies 和类似技术。其中有些是技术上必要的(如会话 cookie 或购物车 cookie),而另一些则是非必要的,它们有助于我们改进在线业务和经济地运营网站。
更多信息