µTrace®
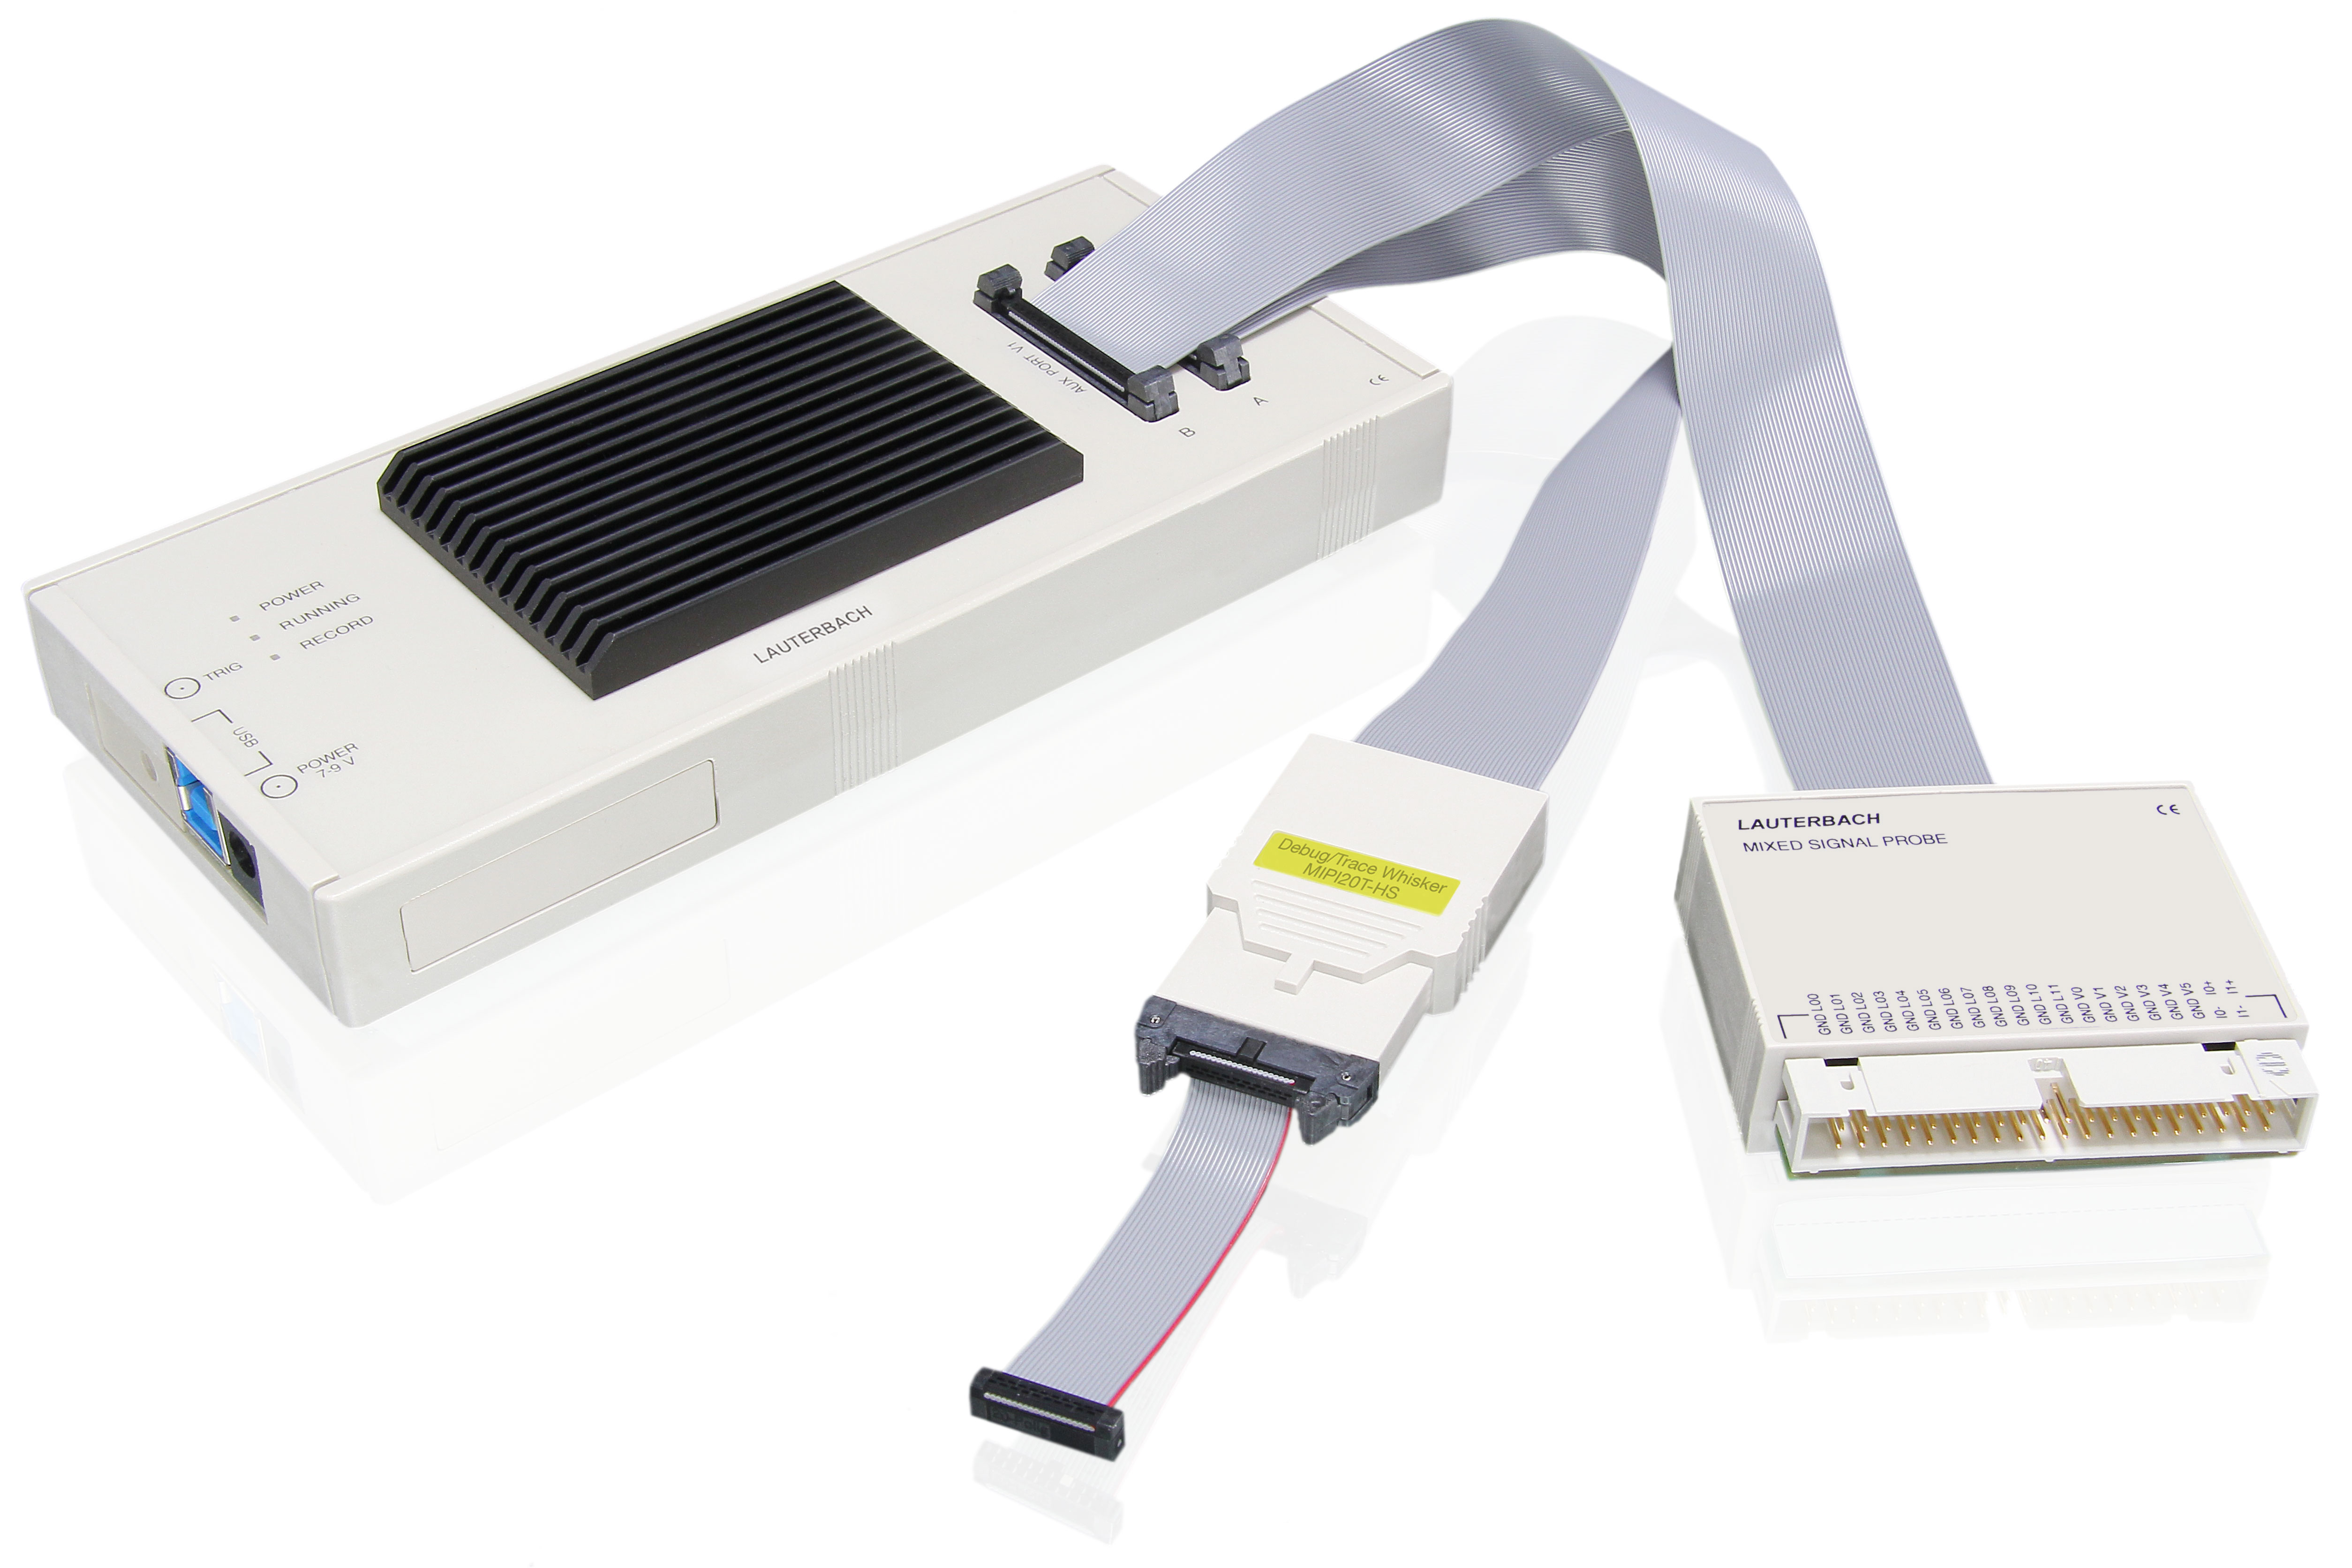


经济的一体化调试和跟踪模块
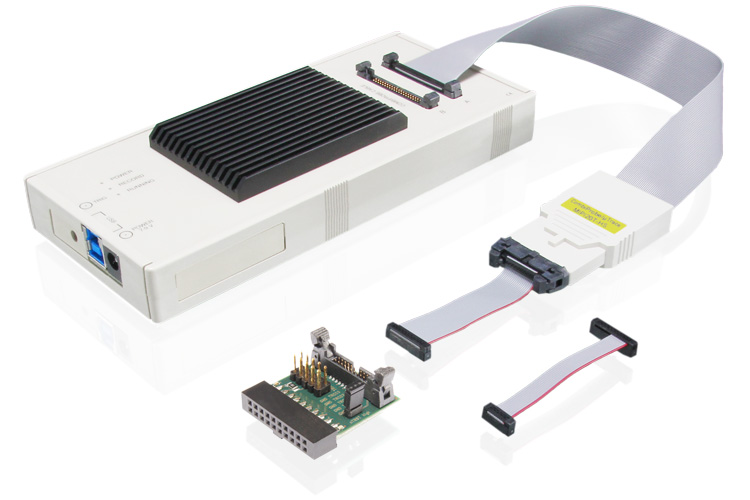
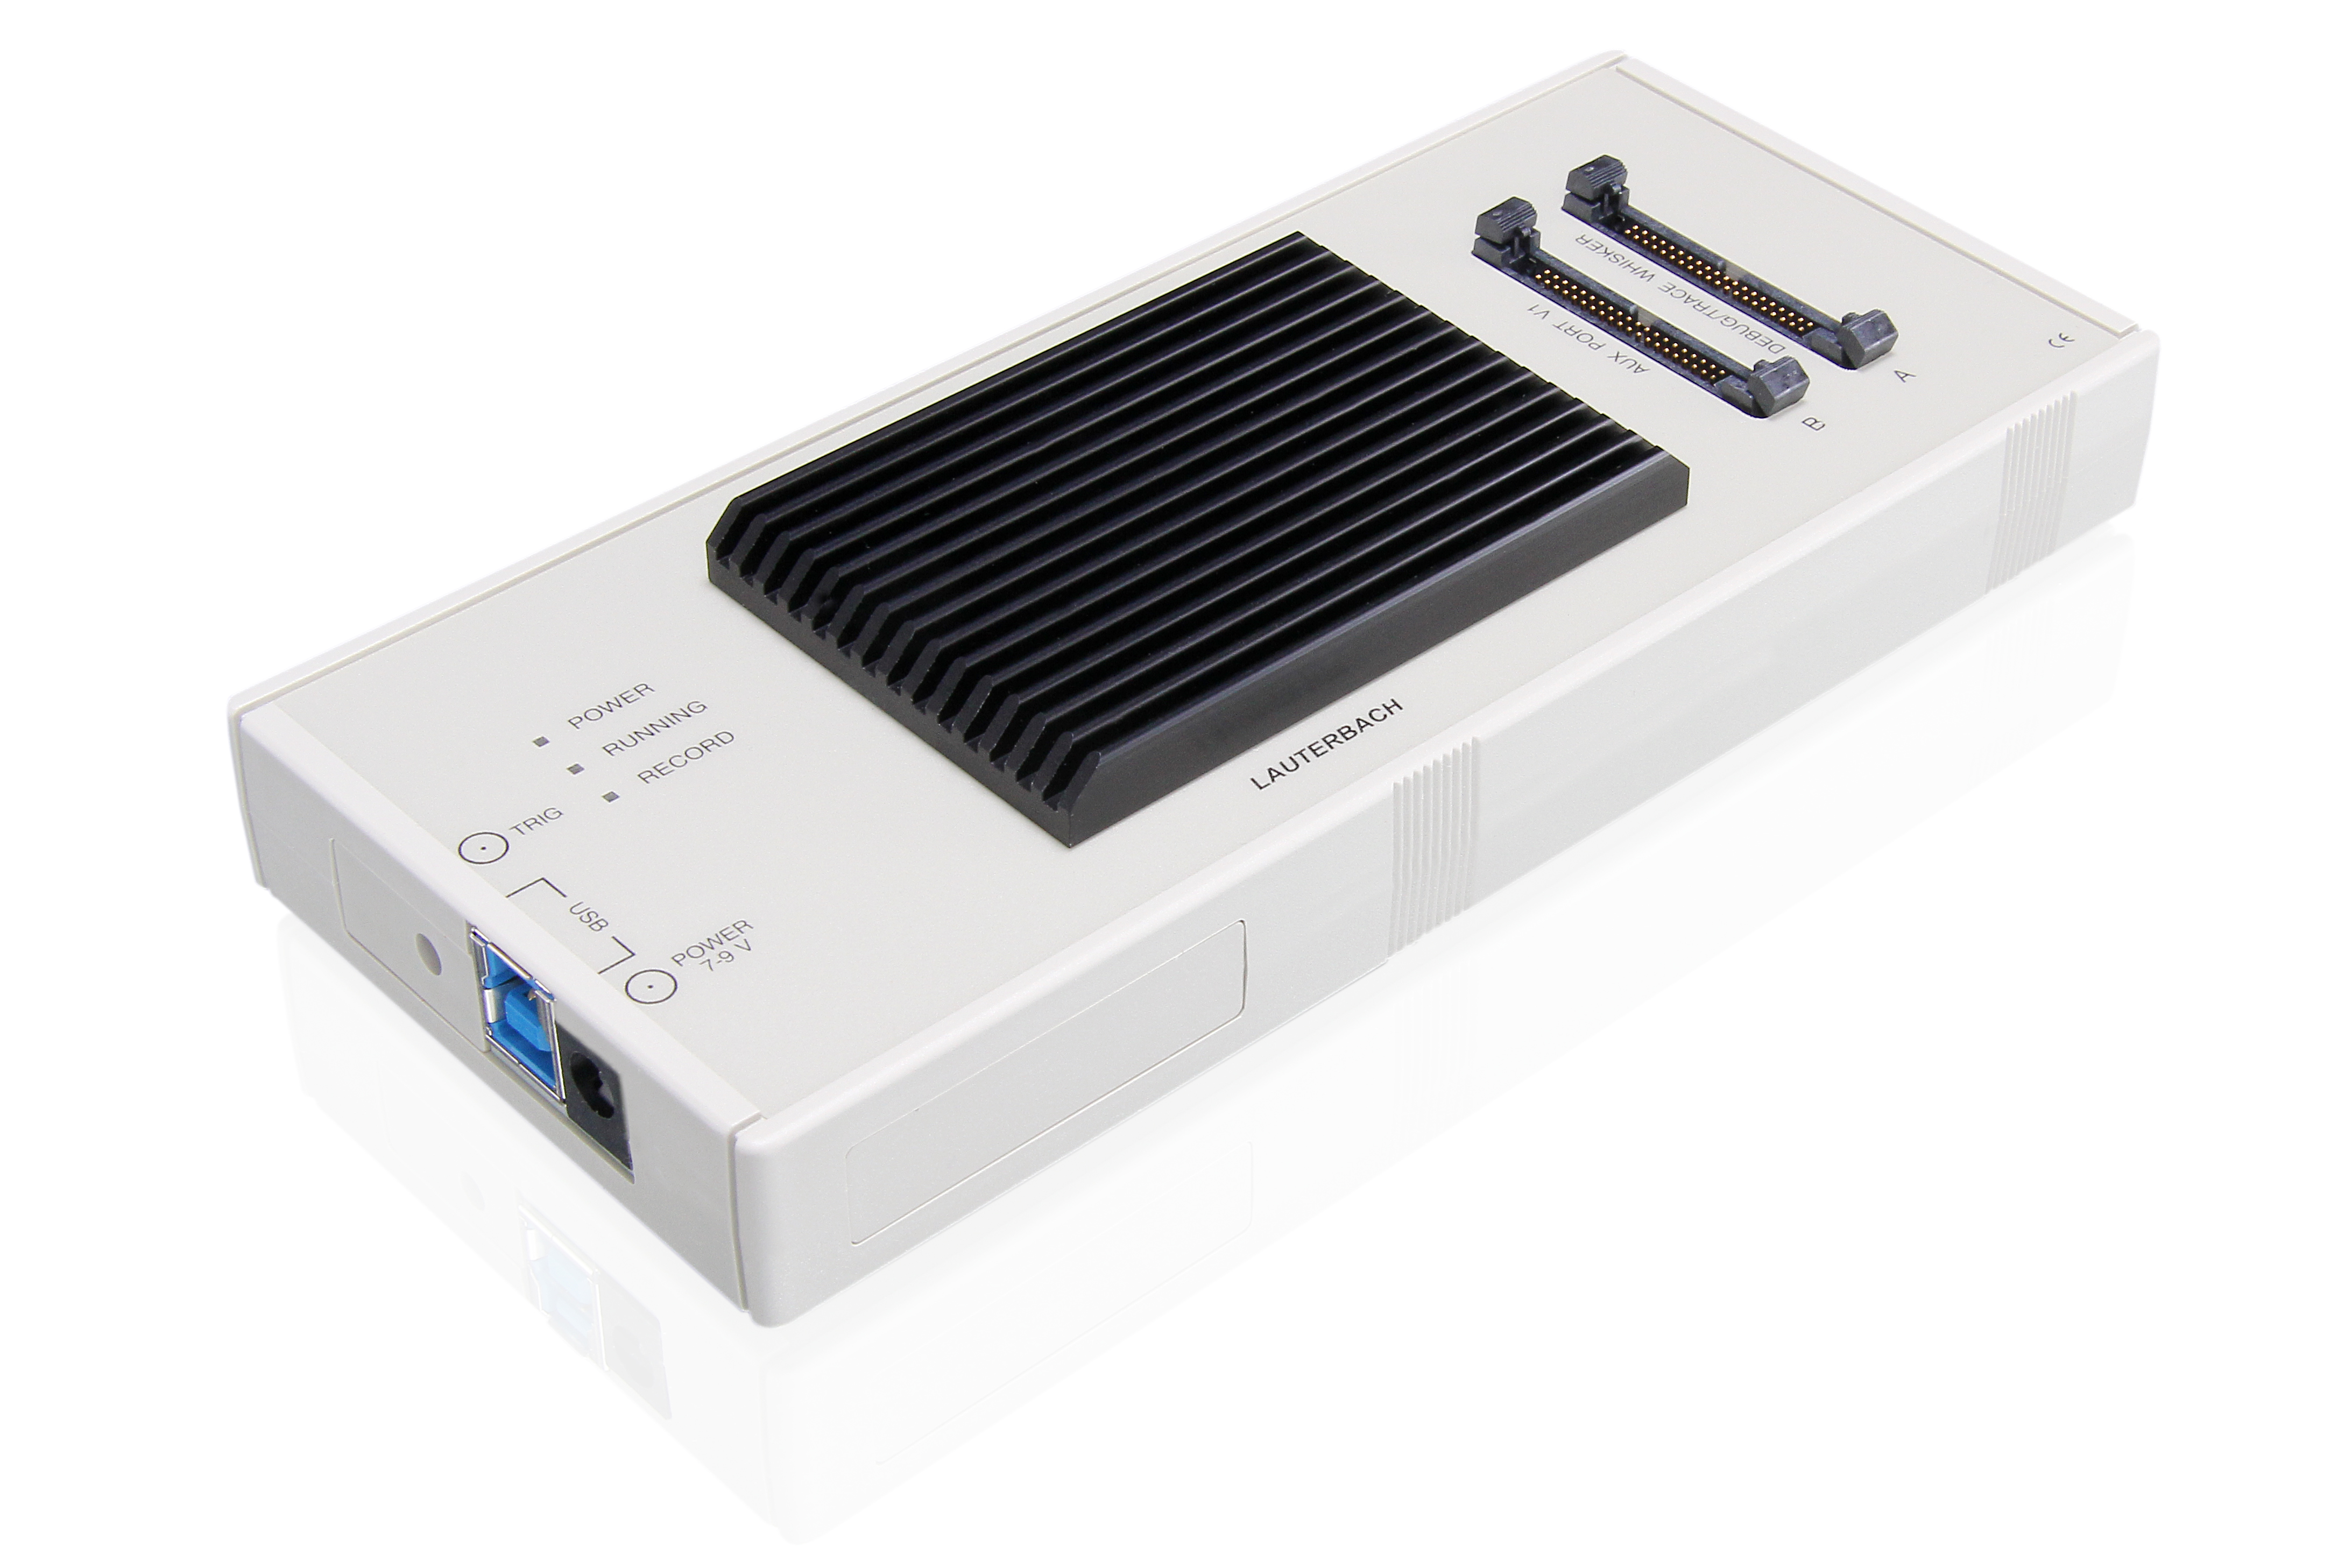
Leverage the power of a full debug and trace system specifically geared towards your embedded design. µTrace® is our cost-effective all-in-one solution that provides all functions for Arm® Cortex®-M or RISC-V RV32 cores, and shines especially for microcontrollers with a parallel trace port of up to 4 pins.
享受毫不妥协的劳特巴赫质量、功能和支持
µTrace® provides you the same features that our industry leading high-end products are known for: highest quality, exceptional functionality and superior support. In addition to its leading debug capabilities, µTrace® can capture real-time information like system traces and parallel flow traces, enabling e.g. Code Coverage and Code Profiling. In many use cases, real-time trace can bring embedded designs to market faster, safer and with more reliability.
撬动行业中的最高性能
Our µTrace® supports data rates up to 400 Mbit/s per trace line from the Arm® CoreSight™ Trace Port Interface Unit (TPIU) or the RISC-V Pin Interface Block (PIB). This is 30 percent faster than competing trace tools for embedded systems. To ensure proper sampling at these speeds, our AutoFocus eye-finder automatically detects the perfect sampling point for each trace line.
具有最高流媒体性能的超长跟踪
通过将跟踪数据流传输到主机,捕捉极长期的跟踪记录,以供日后分析。 140 MB/s(1.2 Gbit/s)的平均数据流速度确保了无数据丢失的可靠传输,代表了该细分市场的最高数据传输速率。我们的 TRACE32®PowerView 软件可在目标运行时即时更新和显示代码覆盖结果。
从你的应用中榨取最后的毫瓦特
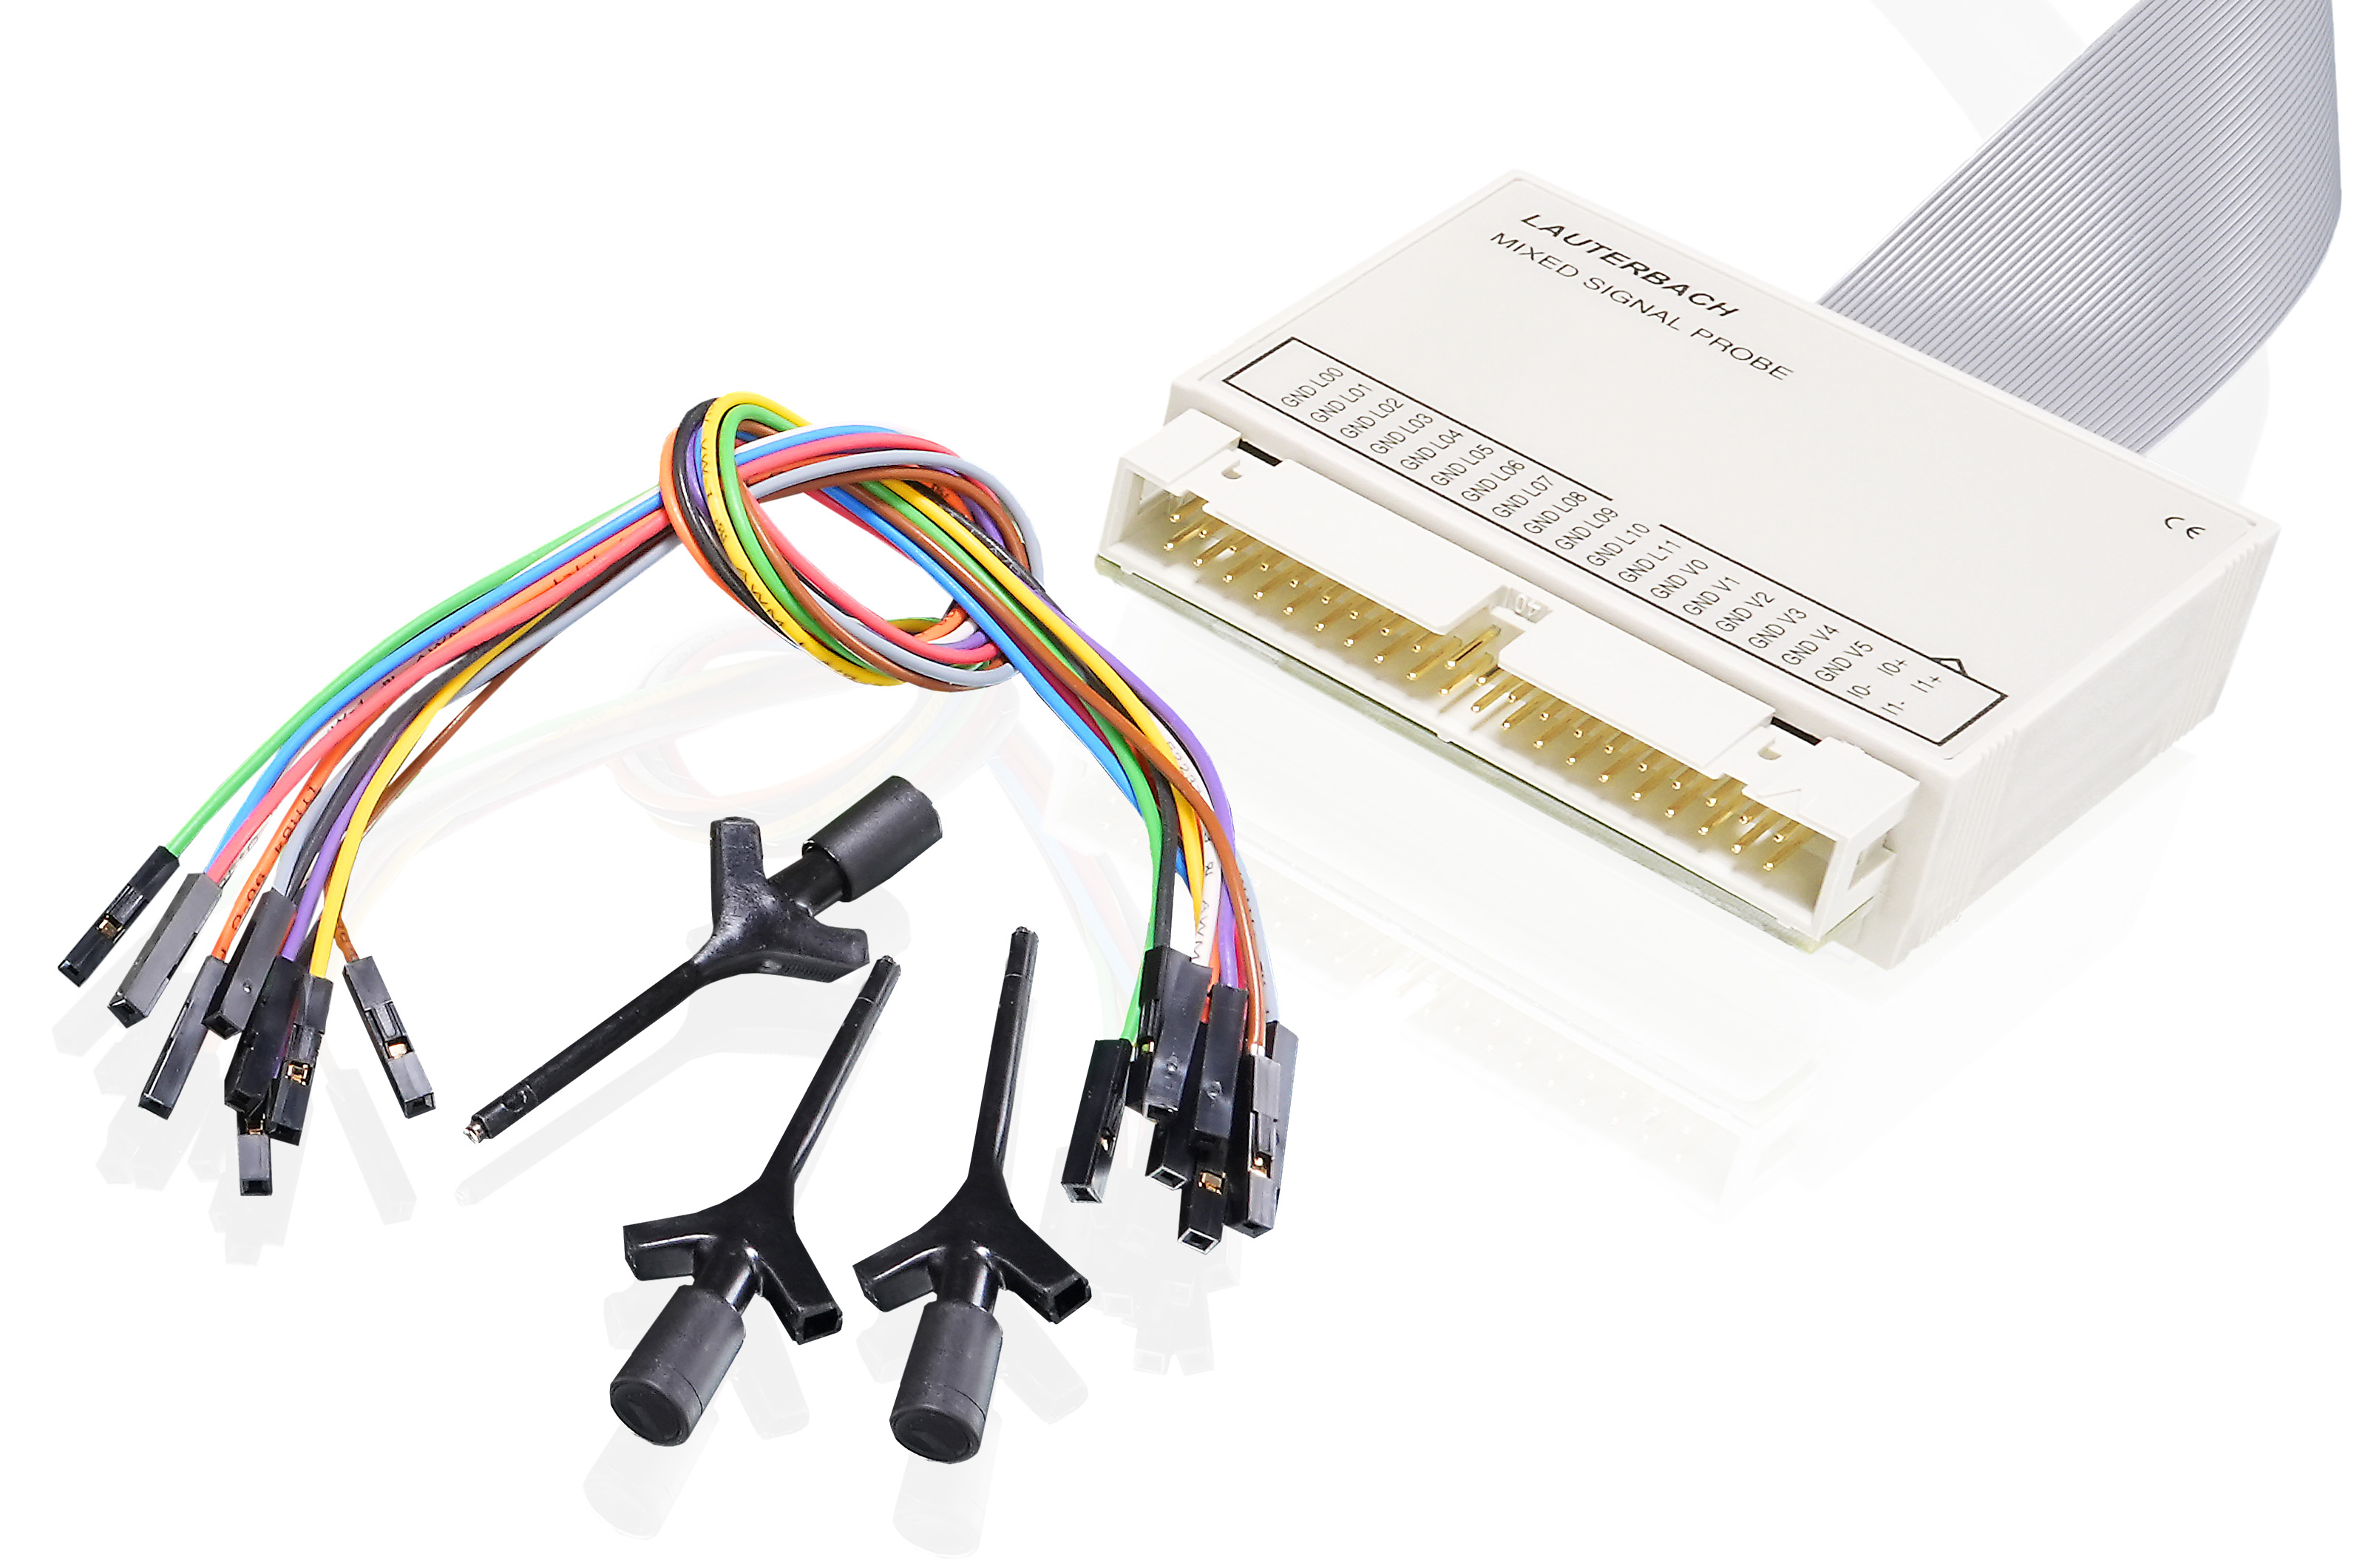
By adding our optional Mixed-Signal Probe, your µTrace® can record detailed measurements of the power consumption of your embedded system over time. If your microcontroller additionally supports off-chip trace, you can perform Energy Profiling to locate all power-hungry code sections, which is especially important in power sensitive applications.
从内部和外部观察你的SoC
In combination with the Mixed-Signal Probe, your µTrace® can sample analog and digital signals and decode the protocols send on digital lines. If your microcontroller support program flow trace, the recorded signals can be correlated, drawing a coherent picture of what is happening simultaneously inside the chip and outside at the pins and peripherals of your SoC package.
调试任何 Cortex-M 和任何 RV32芯片 - 包括隐藏内核
通过使用我们的 µTrace® 调试单核和多核微控制器及 SoC 中的 Cortex-M 和 RV32 内核,您可以调试的内核数量在业内遥遥领先:目前,我们支持数十家制造商提供的 7,000 多个芯片 。我们会定期添加新的芯片 ,并在新的芯片 设计发布时为其提供支持。除了广泛支持公开的 IP 外,它还可以调试从未公开发布的内核,为您的机密 IP 保守秘密。
享受我们完整的功能集和熟悉的用户界面
通过PowerView ,我们开发了一个独特的用户界面,该界面在我们的产品和支持的操作系统中保持一致。使用 µTrace®,您将受益于我们完整的调试和跟踪功能,并且无需任何额外培训即可立即上手。
µTrace®的技术数据
本产品 |
||||
| 产品 | PowerDebug X51 + PowerTrace | PowerDebug E40 +CombiProbe 2 |
µTrace® for Cortex-M | µTrace® for RISC-V |
| PC Interface |
USB 3.2 Gen 1, Type C and 2.5 Gigabit Ethernet | USB 3.2 Gen 1, Type B | USB 3.2 Gen 1, Type B | USB 3.2 Gen 1, Type B |
| 电压范围 | from 0.4 to 5.0 V 1 |
from 1.2 to 5.0 V 5 | 1.2 to 5.0V |
1.2 to 5.0V |
| 调试协议 | JTAG, cJTAG, SWD, DAP and many more | JTAG, cJTAG, SWD, DAP and many more | JTAG,cJTAG,SWD |
JTAG,cJTAG,SWD |
| Extension connectors |
PodBus and PodBus Express |
PodBus |
N/A |
N/A |
| 跟踪端口宽度(Max.)。 | 32 parallel lines2 or 8 serial lanes3 |
two ports with 4 parallel lines |
4 parallel lines |
4 parallel lines |
| 跟踪记录速度(Max)。 | 600+ Mbit/s per parallel line2 22.5 Gbit/s per serial lane3 |
400 Mbit/s per line |
400 Mbit/s per line |
400 Mbit/s per line |
| 跟踪流性能4(Peak / Average)。 | 高达 2 400 / 400 MByte/s | up to 200 / 140 MByte/s |
up to 200 / 140 MByte/s |
up to 200 / 140 MByte/s |
| 跟踪内存大小 | 8 GByte | 512 MByte | 256 MByte | 256 MByte |
| 可选logic analyzer 和能量曲线 | Mixed Signal Probe |
Mixed Signal Probe |
Mixed-Signal Probe | Mixed-Signal Probe |
| 触发连接器 | 4.4V out / 3.3V in (5V tolerant) |
4.4V out / 3.3V in (5V tolerant) |
3.3V out / 3.3V in (5V tolerant) |
3.3V out / 3.3V in (5V tolerant) |
| Supported Architectures1 |
Over 150 microprocessor architectures |
Over 150 microprocessor architectures |
Arm Cortex-M | RISC-V 32-bit (RV32) |
1取决于所使用的debug probe 。
2 With PowerTrace III
3 With PowerTrace Serial 2
4 The streaming rate defines the per-second throughput of data that can be transferred on-the-fly to the PC. If the trace-port rate is below the average streaming rate, a practically infinite recording time (limited only by disk space and speed) possible. The peak-rate is possible temporarily and is compensated by the internal memory of the PowerTrace extension.
5 Depends on Whisker plugged to CombiProbe.
利用AutoFocus 技术最大化带宽
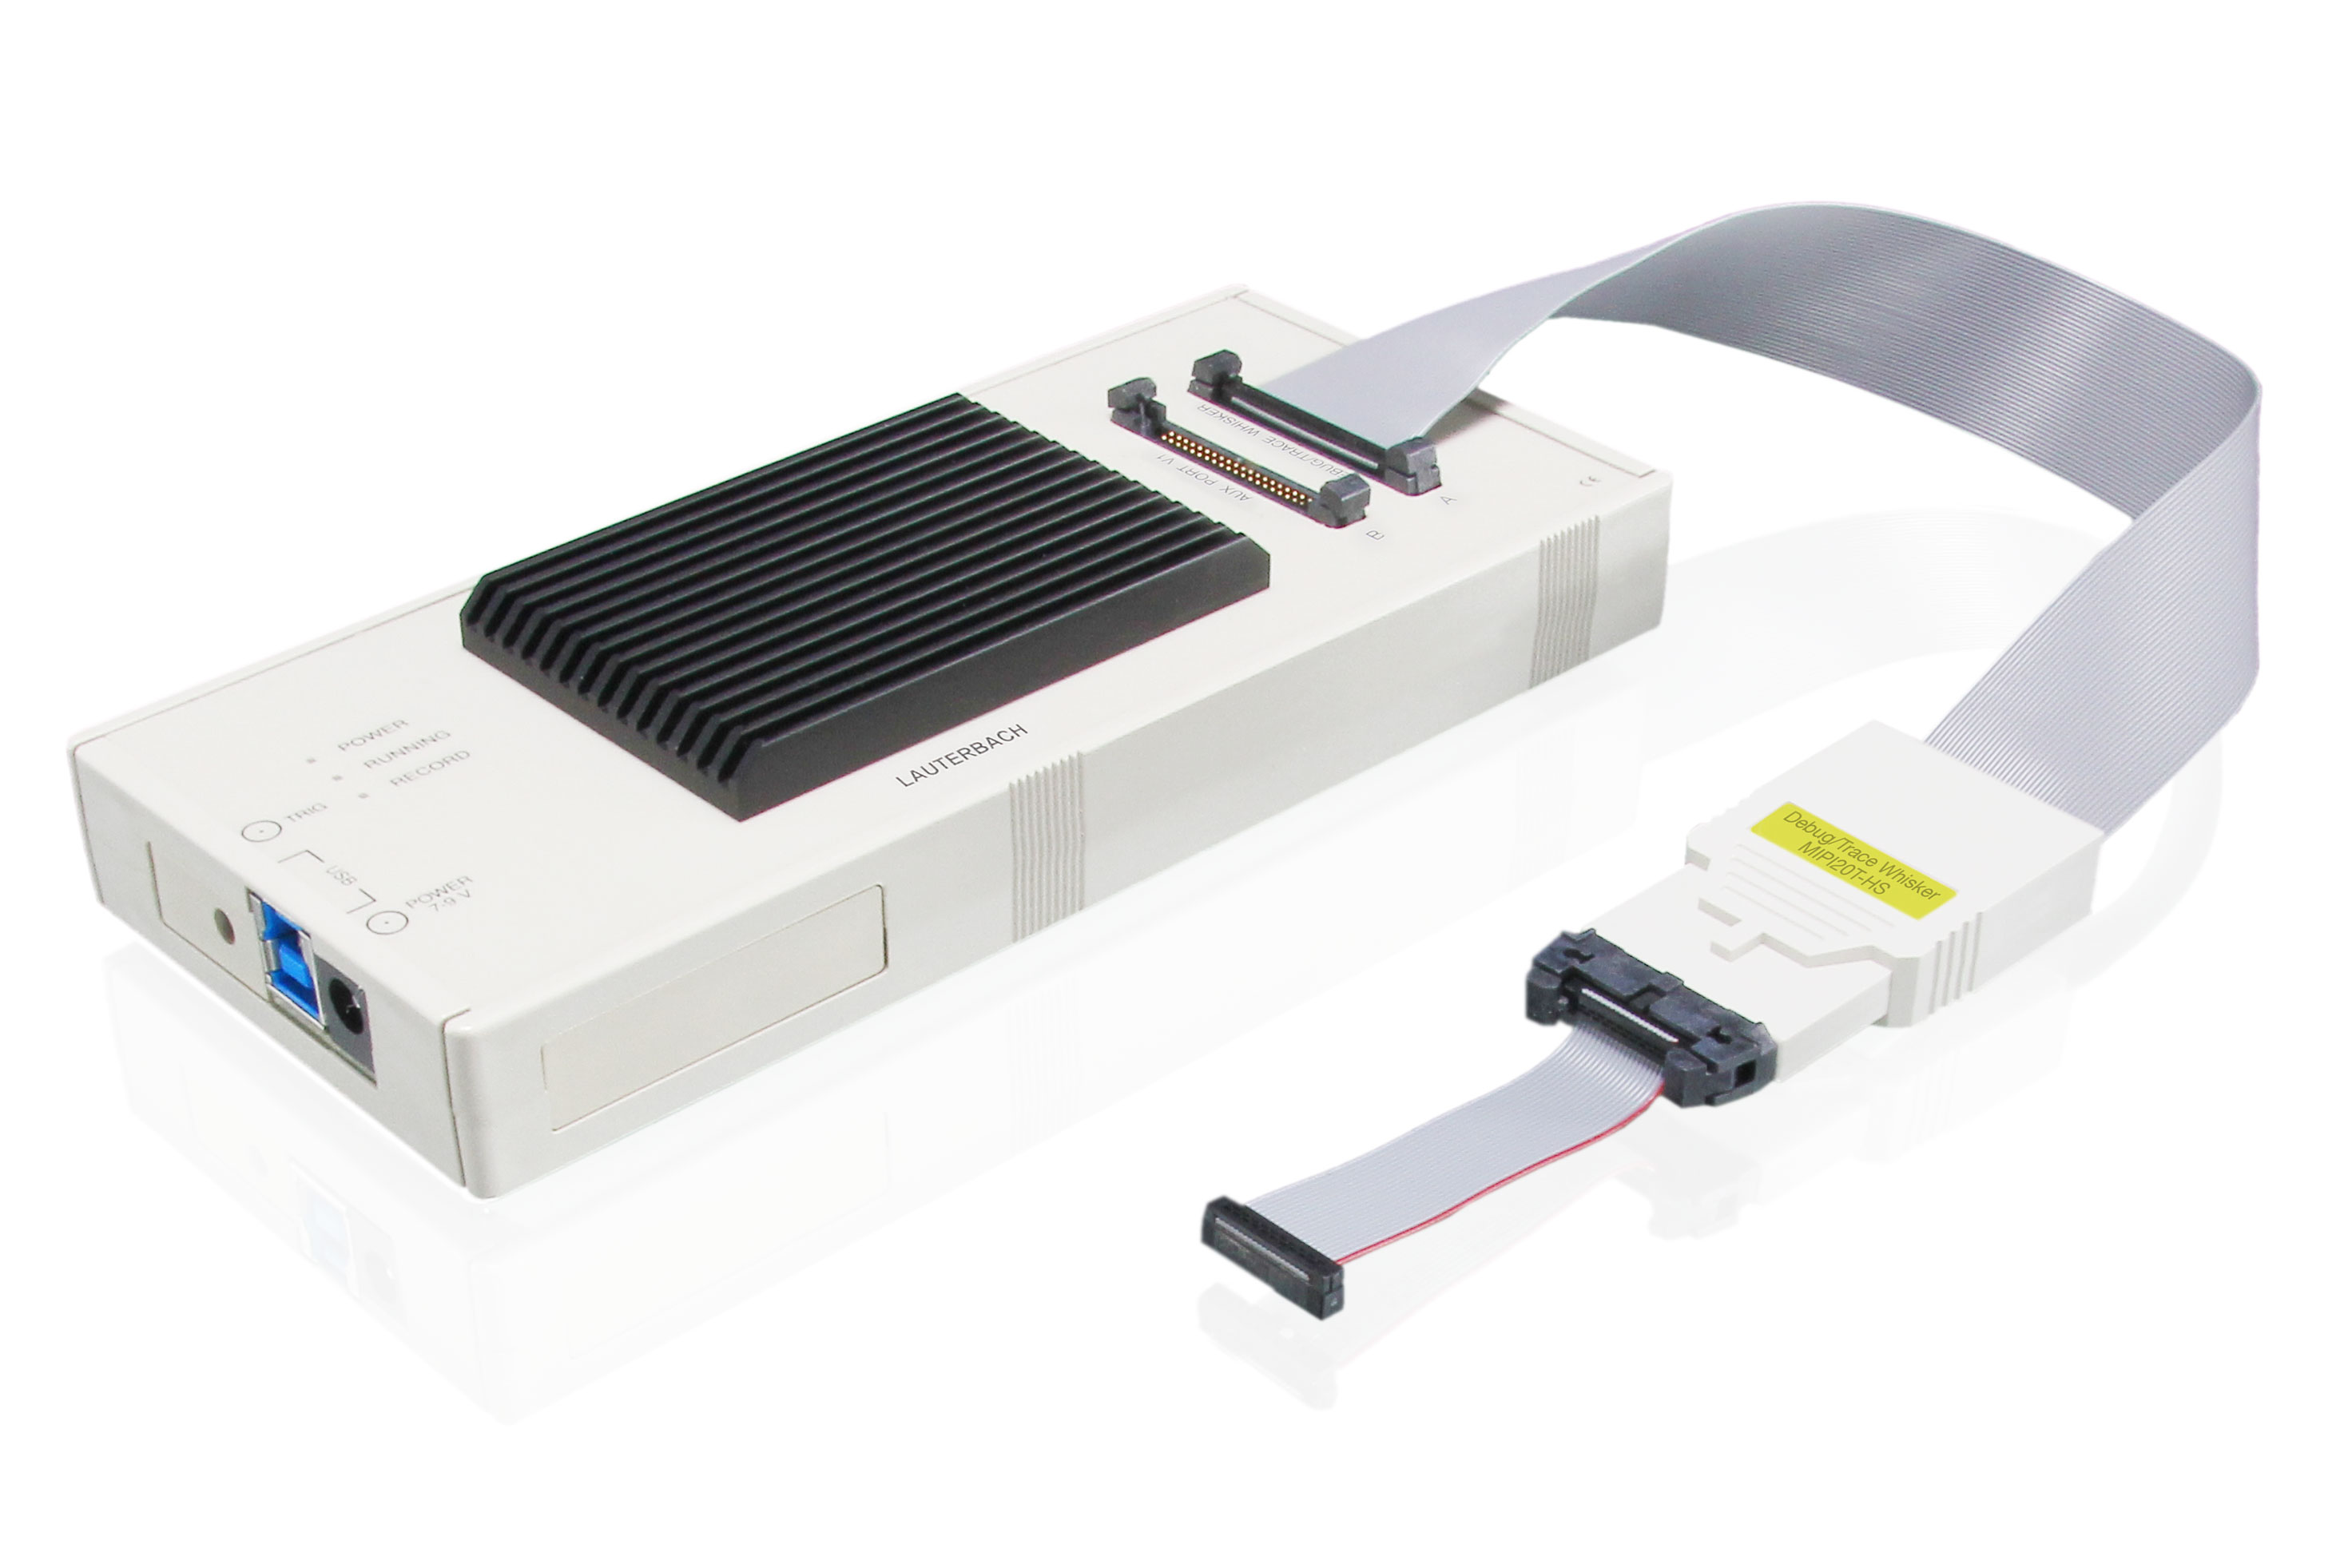
µTrace 通过随附的 MIPI20T-HS 晶须连接到目标器件的调试/跟踪端口。该晶须支持我们的AutoFocus 技术,可自动调整跟踪线每个信号的采样点。这样就能实现更可靠的跟踪捕获,同时减少对电路板布线、阻抗和长度匹配的担忧。
查看 Whisker MIPI20T-HS 了解AutoFocus 技术

µTrace®的配置实例

应用分析和操作系统感知的Cortex-M调试
除调试外,µTrace® 还支持记录程序流程和用户选择的数据地址访问时间。通过使用嵌入式跟踪宏单元 (ETM)、数据监视点和跟踪单元 (DWT) 以及 CoreSight ITM,您可以把它想象成实时记录芯片 内部发生的事情的电影。我们的PowerView 软件将跟踪端口接口单元 (TPIU) 发出的两个跟踪流关联起来。因此,您可以精确地查看是哪条指令导致了特定的数据访问。通过关联,您还可以了解目标操作系统的任务开关,从而对应用程序进行剖析。
配置产品
-
µTrace for Cortex-M (incl MIPI20T-HS Whisker)

记录数字/模拟信号以及与程序流程的关联性
对于采用 CoreSight 跟踪端口接口单元 (TPIU) 的众多 Cortex-M芯片 ,µTrace® 可以将数字/模拟信号与程序流相关联,因为它为两种记录提供了共同的时间戳。通过将程序流跟踪和信号记录以流式方式实时传输到主机,可以实现超长跟踪记录。为了对记录的数字信号进行解码,我们的 TRACE32®PowerView 软件内置了许多用于 CAN、USB 和 I2C 等常见接口的协议分析器。该软件可轻松扩展,以添加您自己的定制协议分析功能。
- µTrace for Cortex-M (incl MIPI20T-HS Whisker)
- Mixed-Signal Probe

Debug and Trace of 32-bit RISC-V (RV32) Cores
µTrace® for RISC-V is a cost effective solution for debugging myriad 32-bit RISC-V cores and provides all of the well-known TRACE32® features. When you want to eventually debug additional instruction sets, you can easily switch over to any of our other debug products while using the same debug software. The latest RV32 cores often come with tracing capabilities such as N-Trace for profiling and code coverage. µTrace® supports all RISC-V traces stored in an onchip buffer or emitted via a 4-pin offchip-interface such as RISC-V PIB or CoreSight TPIU.
-
µTrace for RISC-V 32-bit (PACK)
µTrace®的变体和扩展
All-In-One Debug and Trace Solution for Arm Cortex-M. Supports 5-pin standard JTAG, cJTAG and Serial Wire Debug Port for Arm Cortex-M cores and SecurCore SC000/SC300 Supports Cortex-M onchip-trace and parallel offchip-trace with up to 4-bits (if supported by the core as well) including ETM flow traces, ITM instrumentation traces and DWT data traces. ITM/DWT can be captured from Serial Wire Output (SWO) as well. Includes 256-MByte of trace RAM. Bandwidth of 400 MBit/s per physical trace pin. Trace Streaming up to 140 MByte/s. Concurrent debugging of two or more Cortex-M cores requires a license for Multicore Debugging MicroTrace (LA-7960N). Can not be upgraded to include support for other core architectures. Extend your MicroTrace with a Mixed-Signal Probe (LA-2500), to record and correlated digital and analog signals.
All-In-One Debug and Trace Solution for 32-bit RISC-V cores (RV32). Supports 5-pin standard JTAG, cJTAG and Serial Wire Debug Port. Supports onchip-trace and 4-bit parallel offchip-trace of RV32 cores (if supported by the core as well). Includes 256-MByte of trace RAM. Bandwidth of 400 MBit/s per physical trace pin. Trace Streaming up to 140 MByte/s. Concurrent debugging of two or more RV32 cores requires a license for Multicore Debugging MicroTrace (LA-7960N). Can not be upgraded to include support for other core architectures. Extend your MicroTrace with a Mixed-Signal Probe (LA-2500), to record and correlated digital and analog signals.
Digital/Analog probe with 40-pin connector for LA-3204 MicroTrace for Cortex-M (PACK), LA-3080 CombiProbe 2 for MIPI20T-HS (PACK), LA-3081 CombiProbe 2 for AUTO26 (PACK), LA-3082 CombiProbe 2 for MIPS32+4-Bit IFLOW (PACK), LA-3083 CombiProbe 2 for MIPI34 (PACK), LA-2520 / LA-2521 PowerTrace III, LA-3121 / LA-3122 PowerTrace Serial 2. Characteristics of digital probe: 12 channels (12 data), 0..5 V Input, 200 MSamples per channel. Characteristics of analog probe: 6 Channels -12V..+12V 13 bit resolution, 2 current sense channels, Conversion rate 1 MSample/s. Includes a set of 12 miniature clamp-type test probes with wires. More test probes can be ordered via LA-6470 Clip Set. Requires TRACE32 software DVD 2021/02 or newer.
允许同时调试 2 个或更多相同内核 请在订单中添加 MicroTrace 的基本序列号 的基本序列号


