ARC 调试器和跟踪
任何 SoC 中的任何 ARC 内核
Benefit from Lauterbach’s leading edge development tools and close partnership with Synopsys to analyze any design, from a single tiny microcontroller to a massive multicore application processor. ARC DesignWare® is a processor IP from Synopsys which can be optimized to fit your System on Chip (SoC).
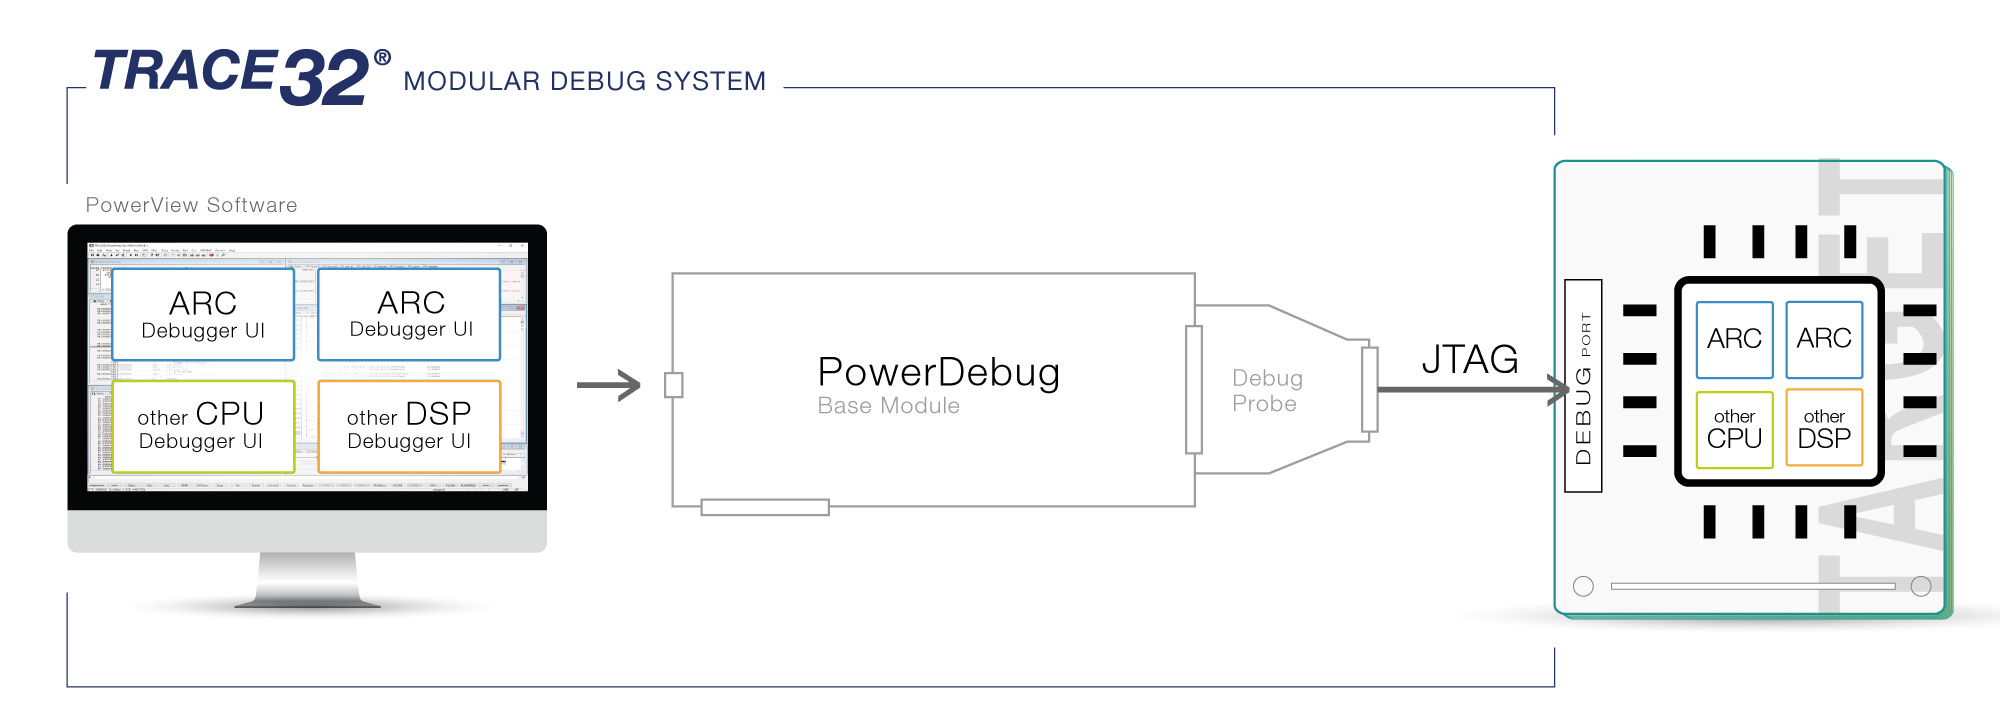
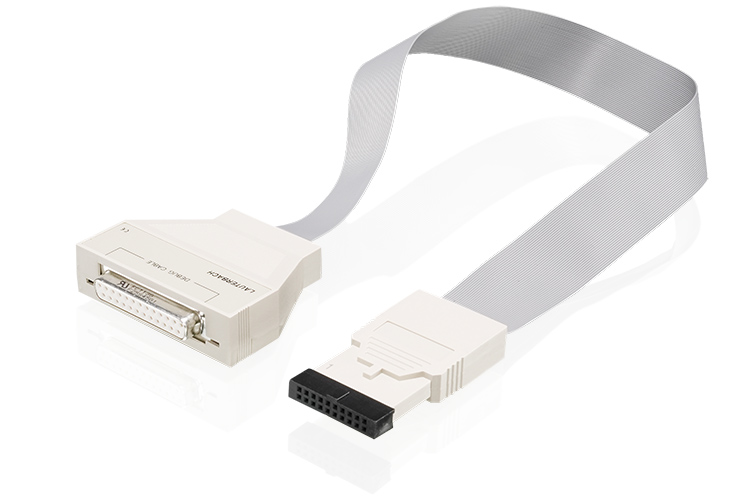
Using our TRACE32® tools you can debug and control any ARC core (along with all of the other cores) in an SoC via a single debug interface, all at the same time. The core configuration is automatically detected including most ARC Designware optional features. For cores implementing the ARC Trace (RTT), TRACE32® tools support real-time on- and off-chip tracing.
支持的分区架构
ARC-HS, ARC-EM, ARC-EV, ARC-VPX, ARC600/700, ARCtangent-A4/A5

Do you want to debug ARC-V?
For debugging ARC-V™ cores like ARC RMX, ARC RHS, or ARC RPX, please see our solutions for RISC-V.
利用所有调试功能
Explore and utilize all the powerful and well-known features of your ARC core with Lauterbach debug modules: full on-chip breakpoint support; run-time memory access; flash programming; benchmark counters; and cache view. And of course, everything is scriptable, enabling you to repeat the same test-sequence over and over.
进一步了解我们的调试系统您想使用哪个 ARC 核心?
查看我们的预定义解决方案目录,找到适合您项目的理想工具集。
捕捉核心行动
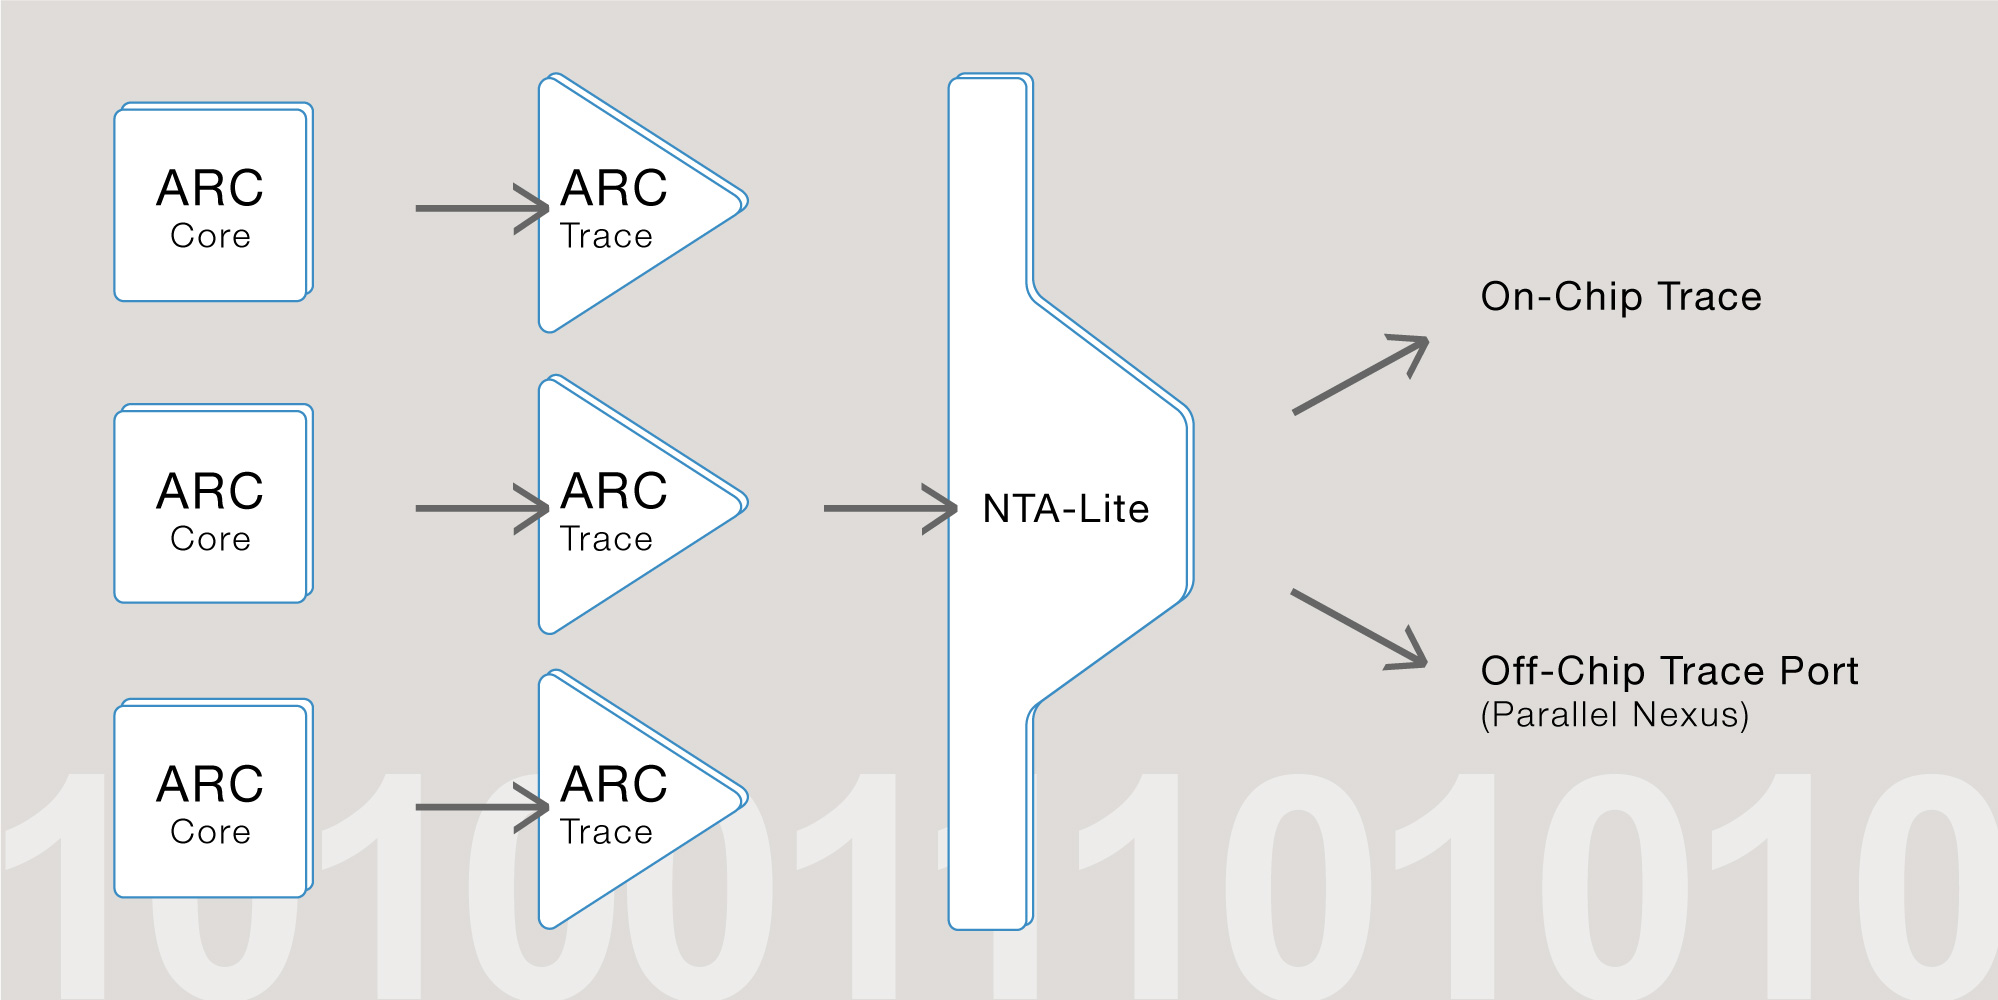
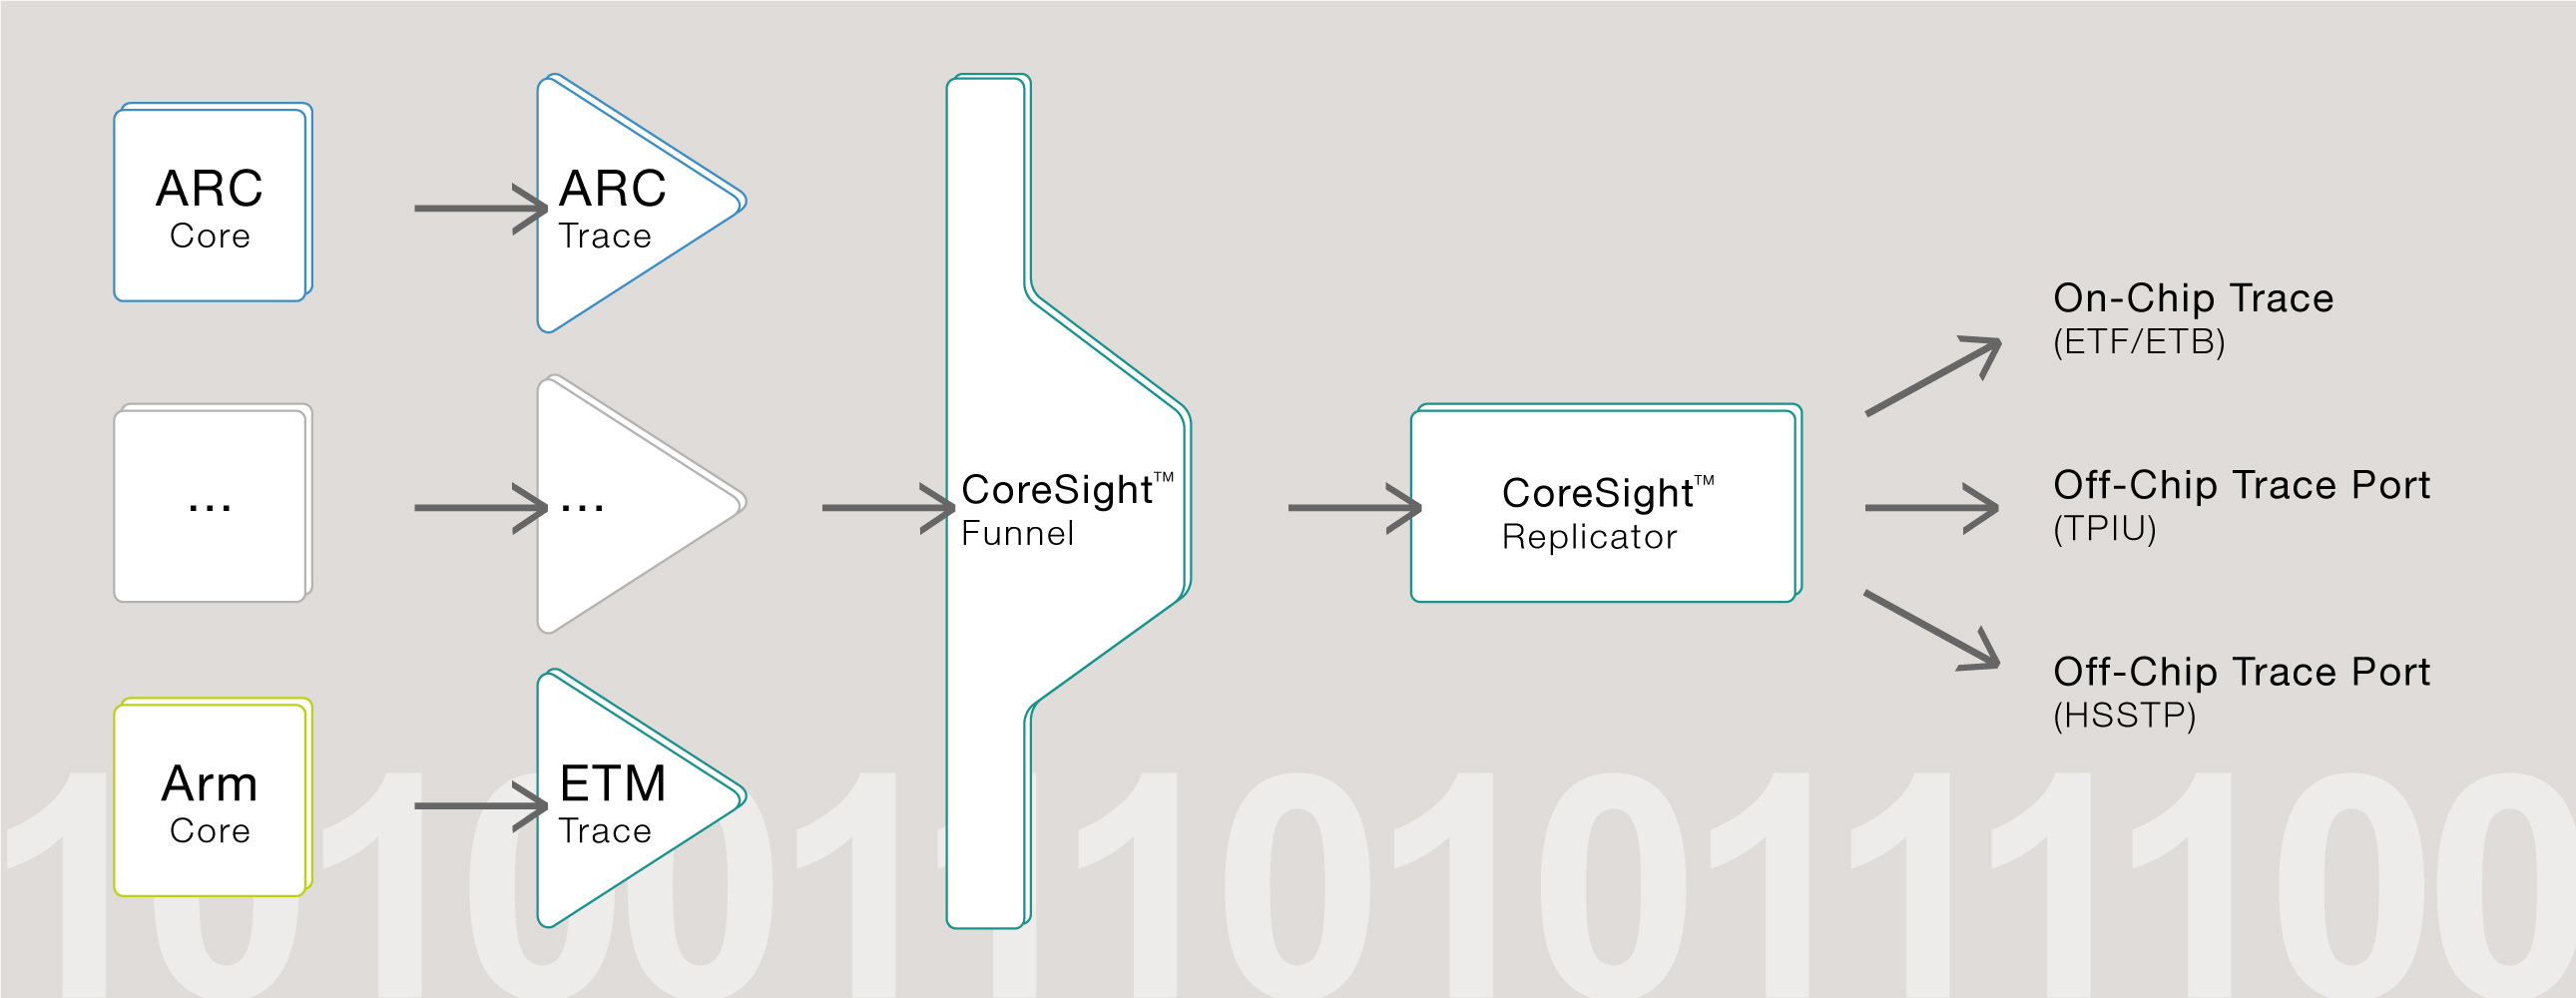
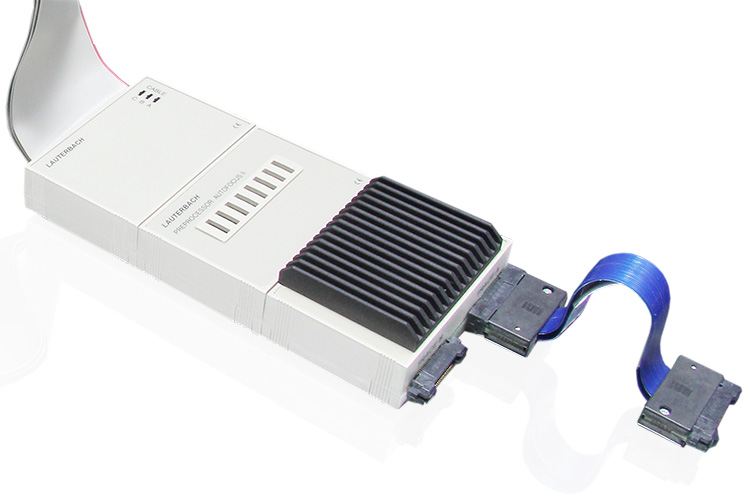
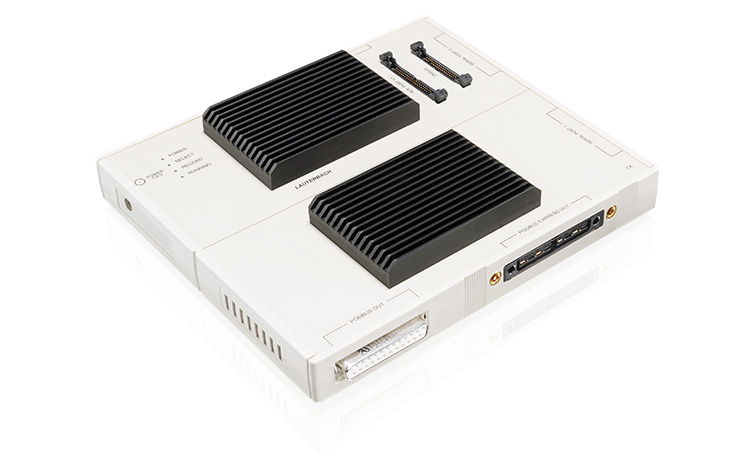
Stop mode debugging can be a powerful tool but tracing is even better. Our trace solutions for ARC support both the SmaRT on-chip trace and the much more powerful DesignWare ARC Trace, which can save the trace-data inside the target memory or emit it to one of our PowerTrace tools. TRACE32® tools also support ARC Trace inside an Arm CoreSight trace infrastructure.
您想使用哪个 ARC 核心?
查看我们的预定义解决方案目录,找到适合您项目的理想工具集。
在您的硅之前做好准备
在 SoC 准备就绪之前,在定制 SoC 中测试 ARC 代码。测试 SoC 需要大量时间,但TRACE32 可让您在虚拟原型和模拟器上开始软件开发,使用的图形用户界面和工具集与您以后在真正的芯片 上使用的相同。在某种程度上,也可以在开始分拆之前验证单个 SoC 的调试接口。
ARC 支持的第三方工具
TRACE32 支持的所有架构 都具有以下功能。如果此处未列出您的设备或工具,请与我们联系;支持通常已经在路上。

