
x86 Debugger & Trace
支持的分区架构
AMD®: Ryzen™ AI Embedded, EPYC™ Embedded, Ryzen™ Embedded | Intel®: Core™ Ultra, Core™, Xeon®, Atom®, Pentium®, Celeron®
Utilize All Debug Features for x86 SoCs
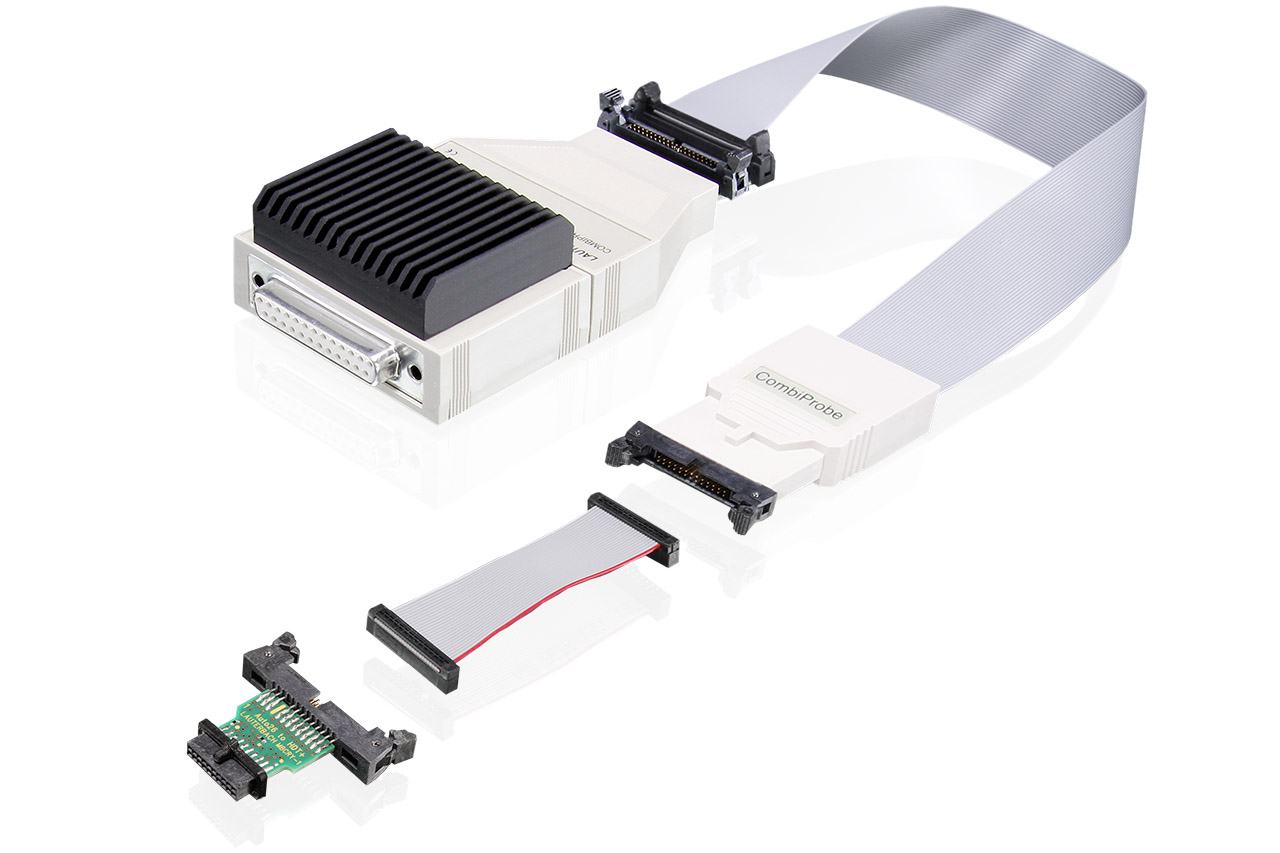
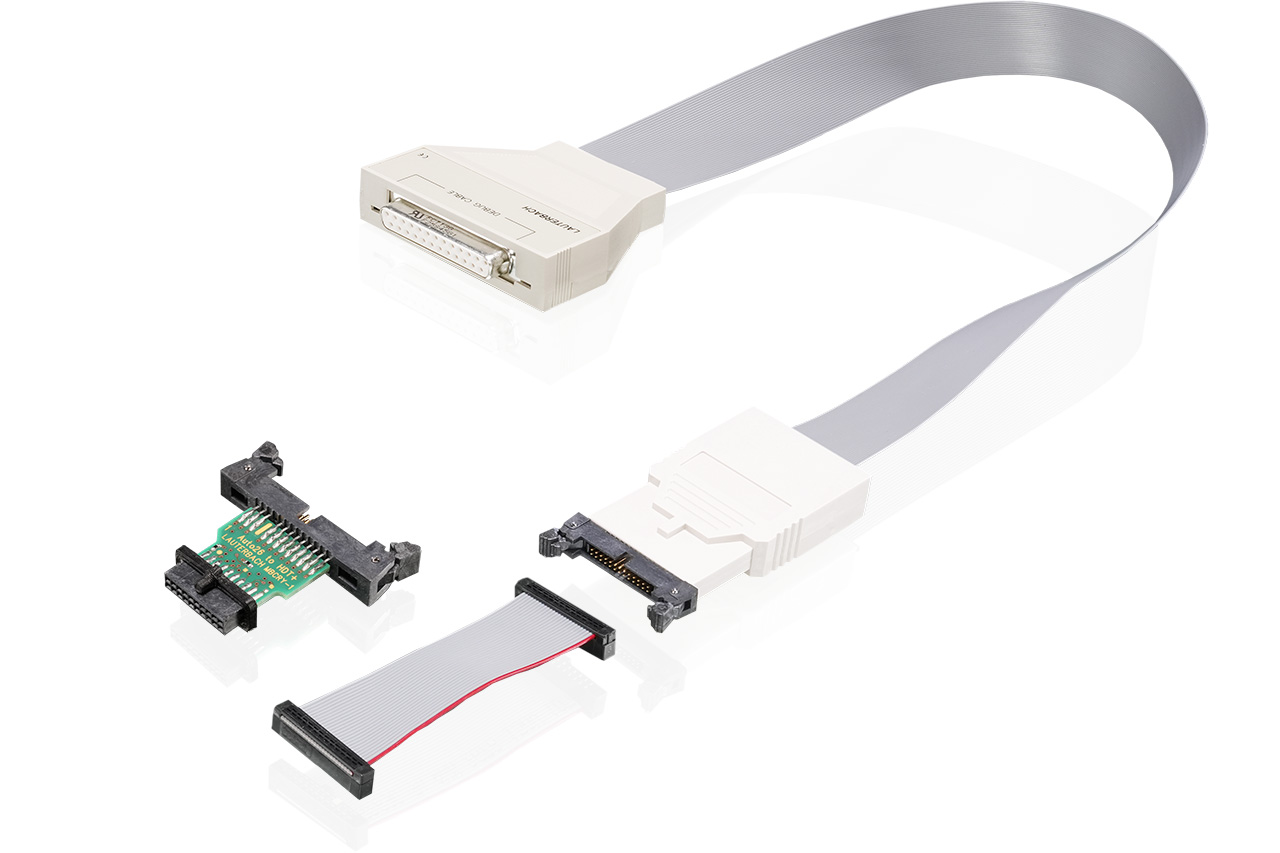
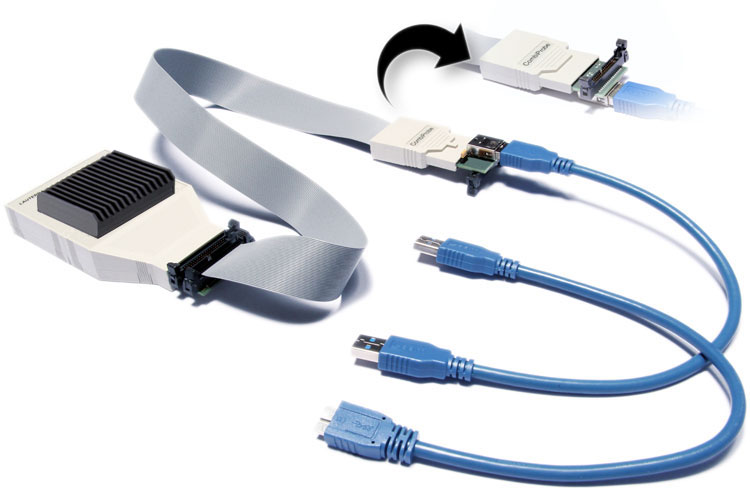
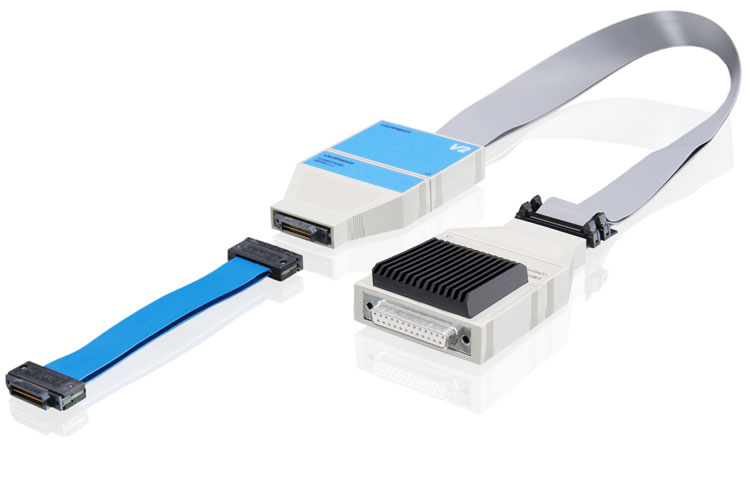
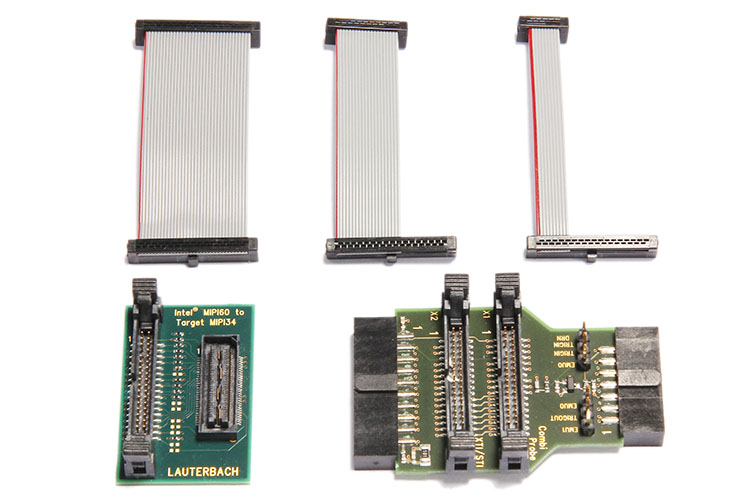
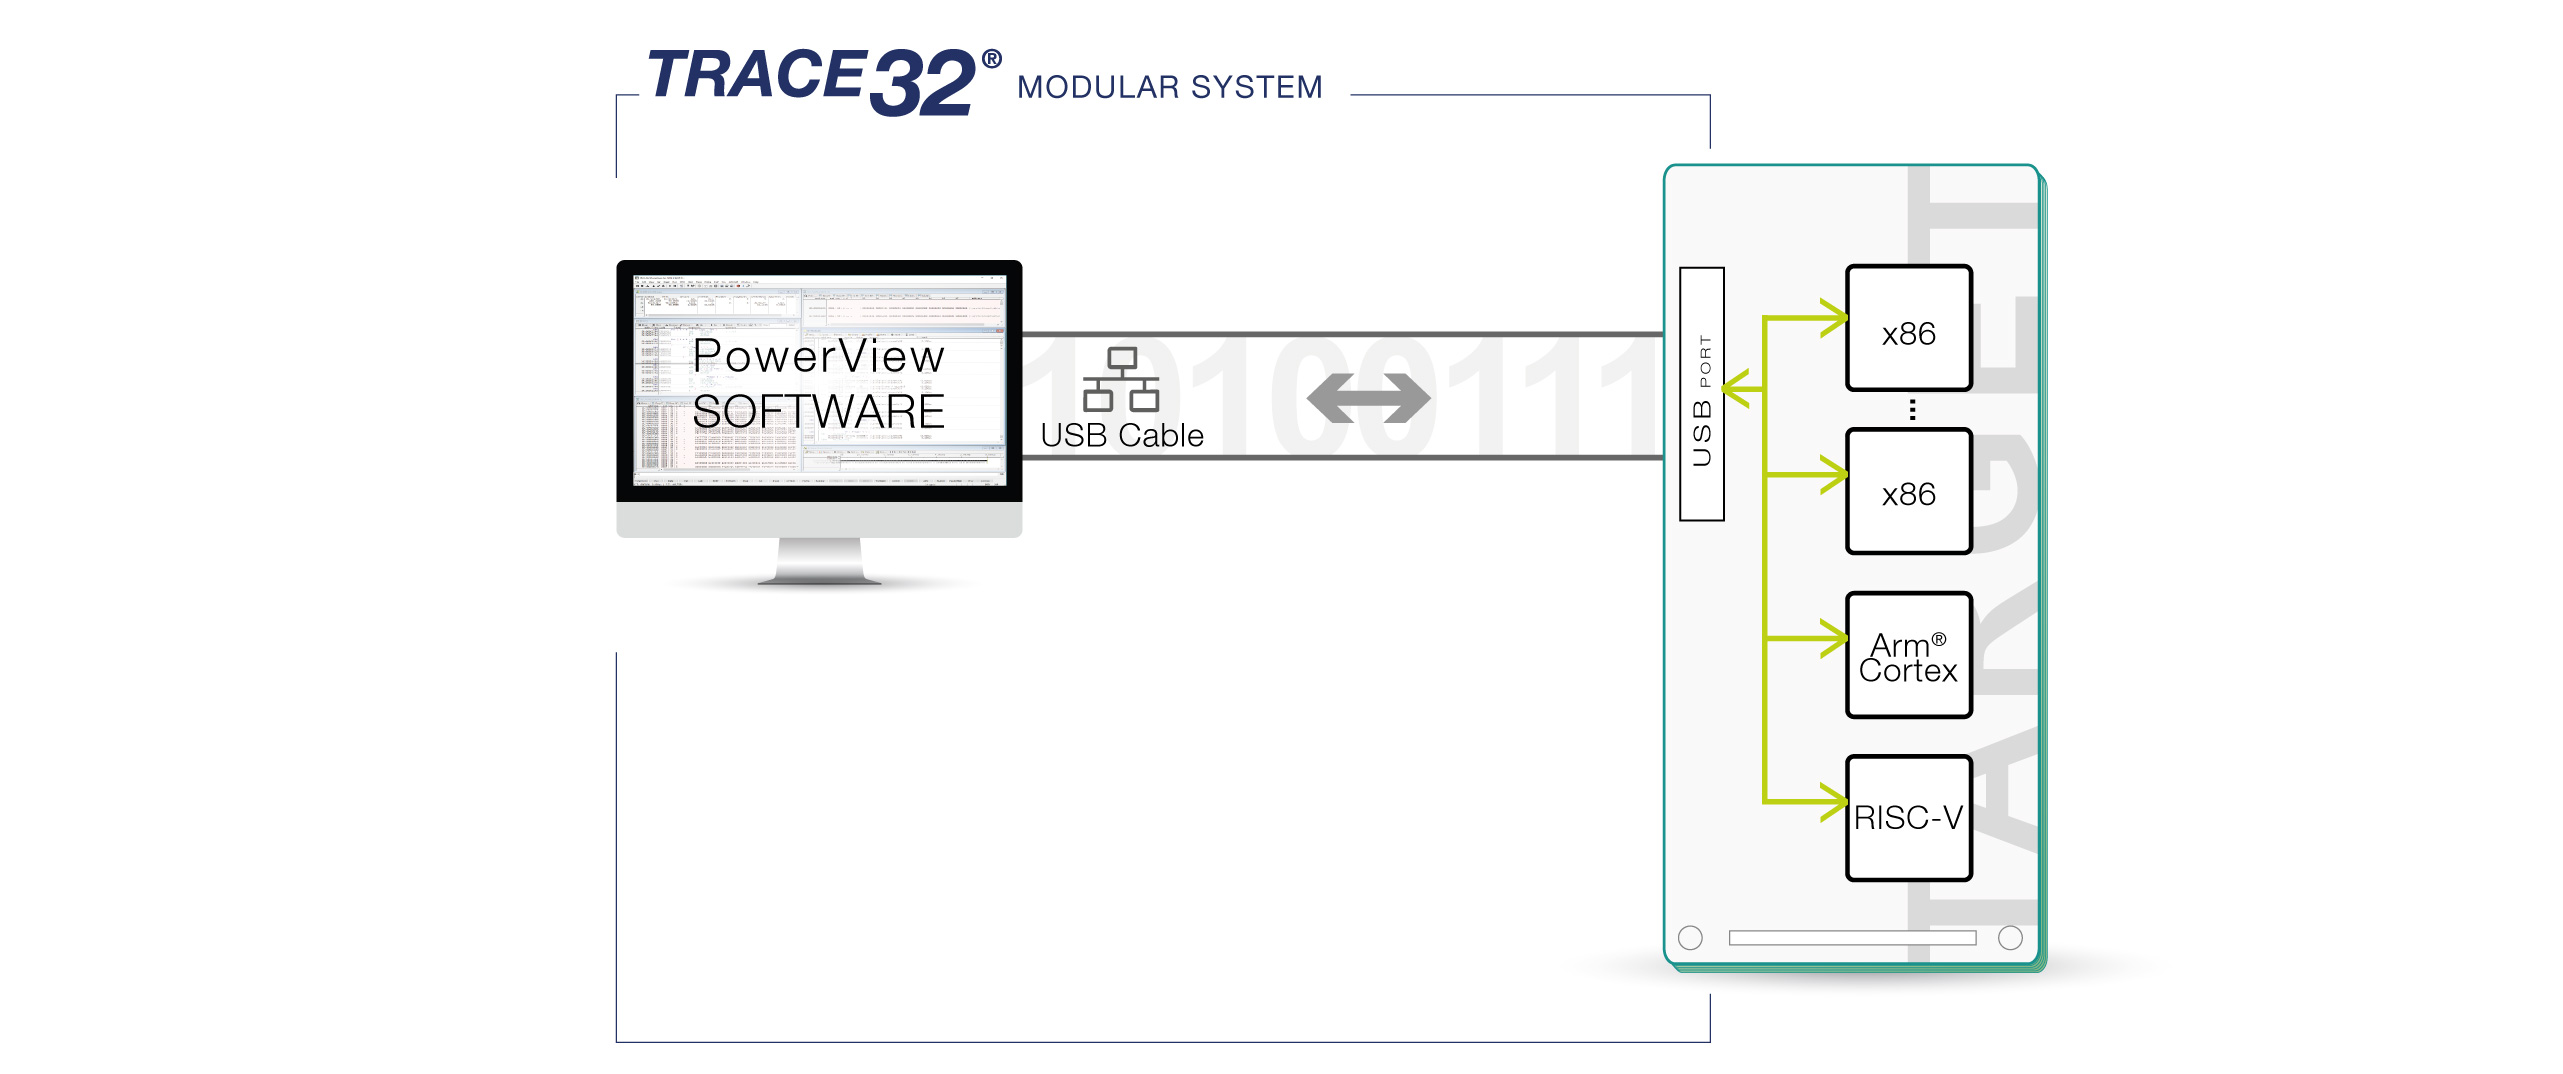
By using our powerful debug modules you can apply our full debug feature set to any supported x86 SoCs. Utilize full on-chip breakpoint support, run-time memory access, flash programming, benchmark counters, MMU and Hypervisor support. Everything is scriptable, which enables you to automate tests very easily.
进一步了解我们的调试系统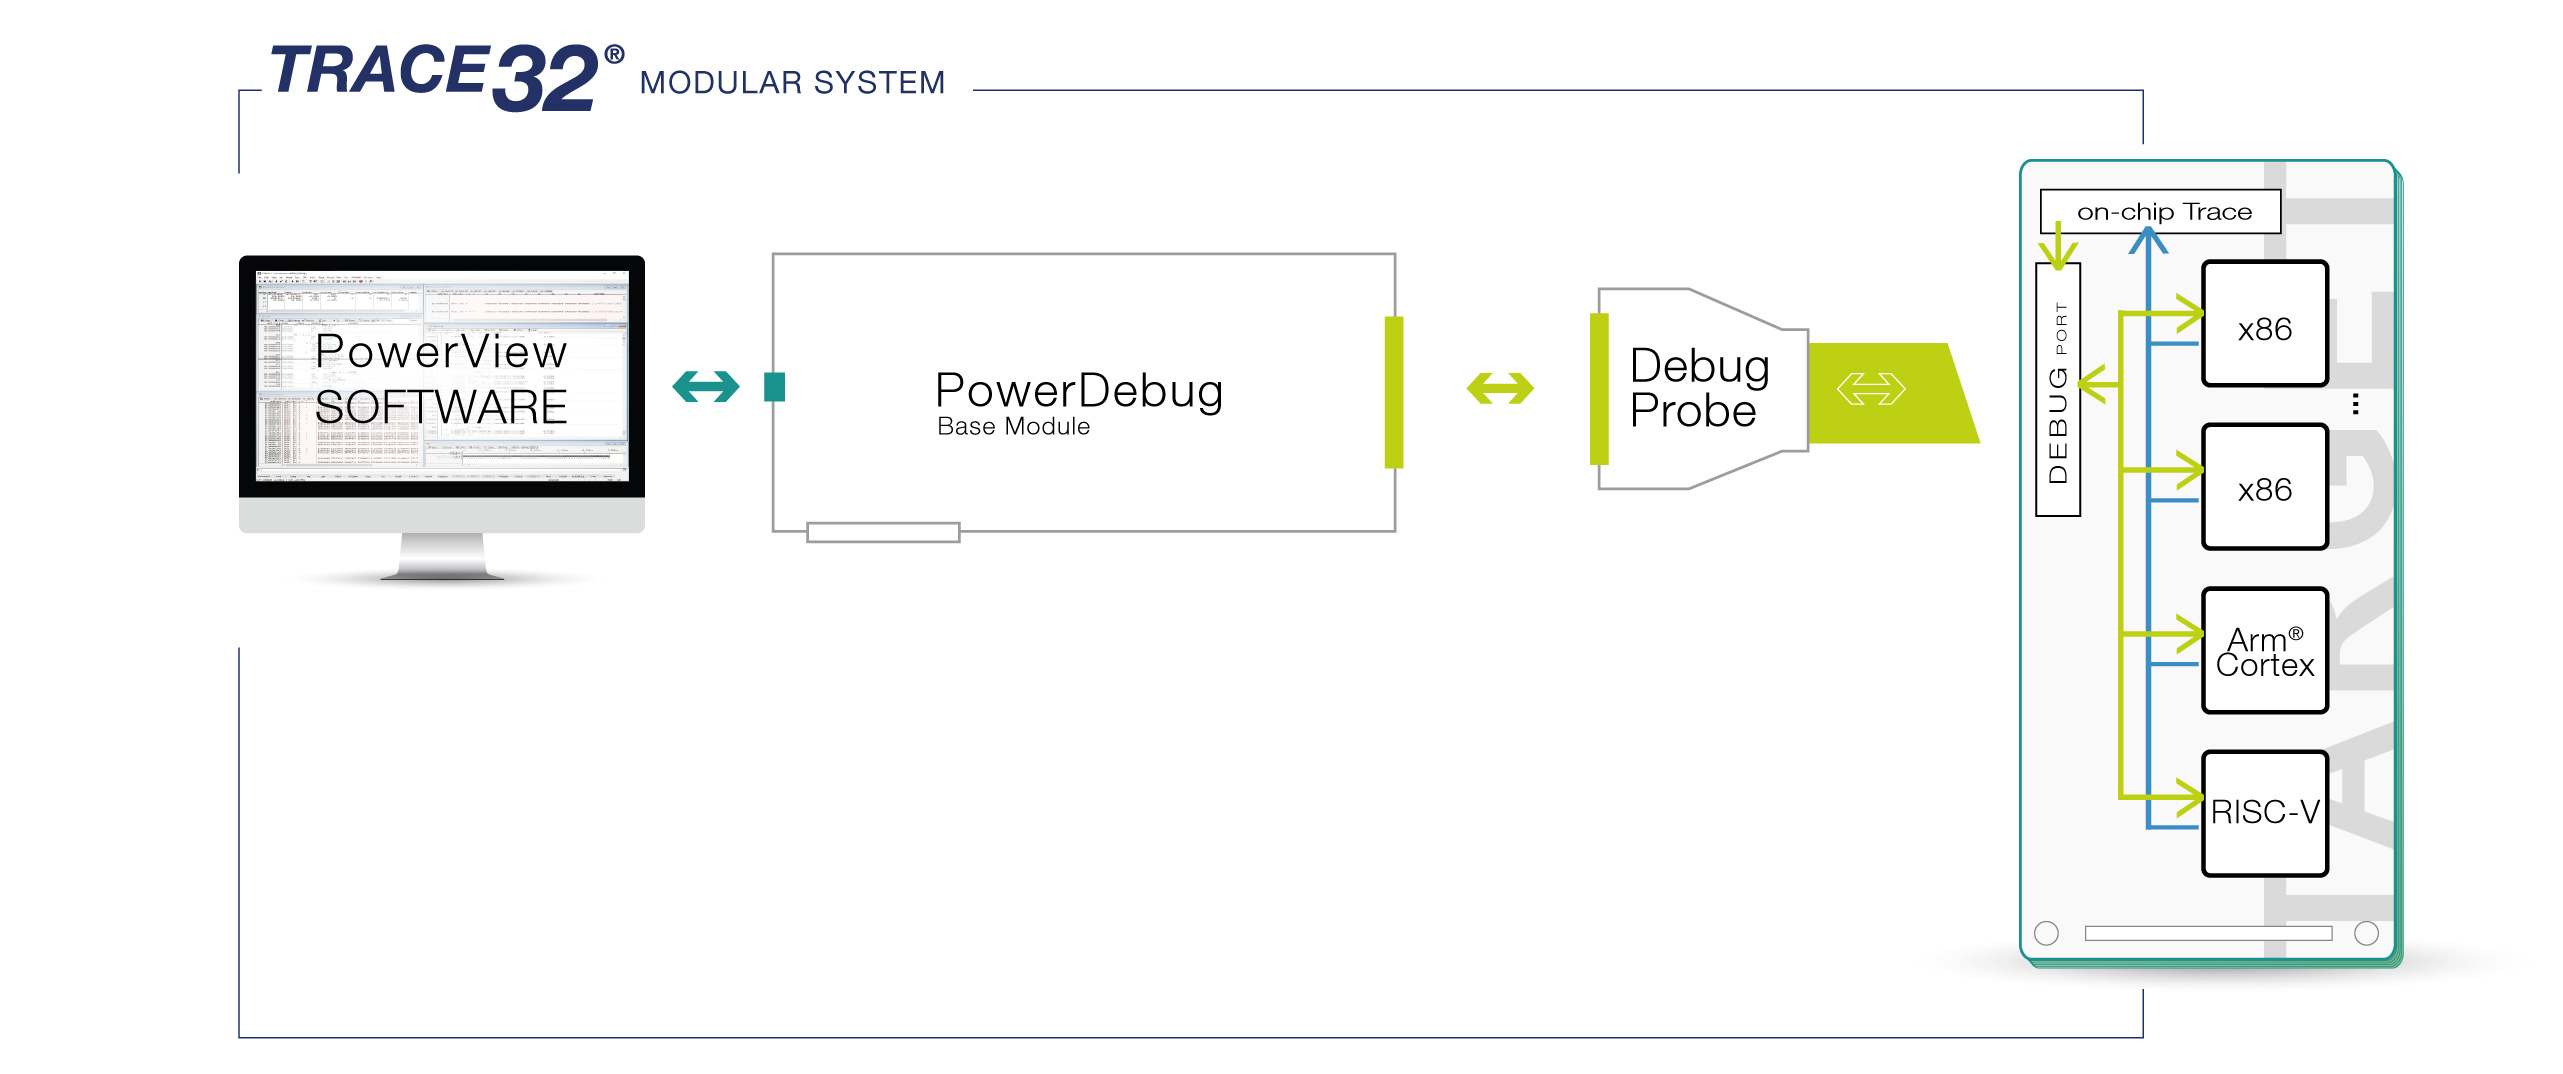
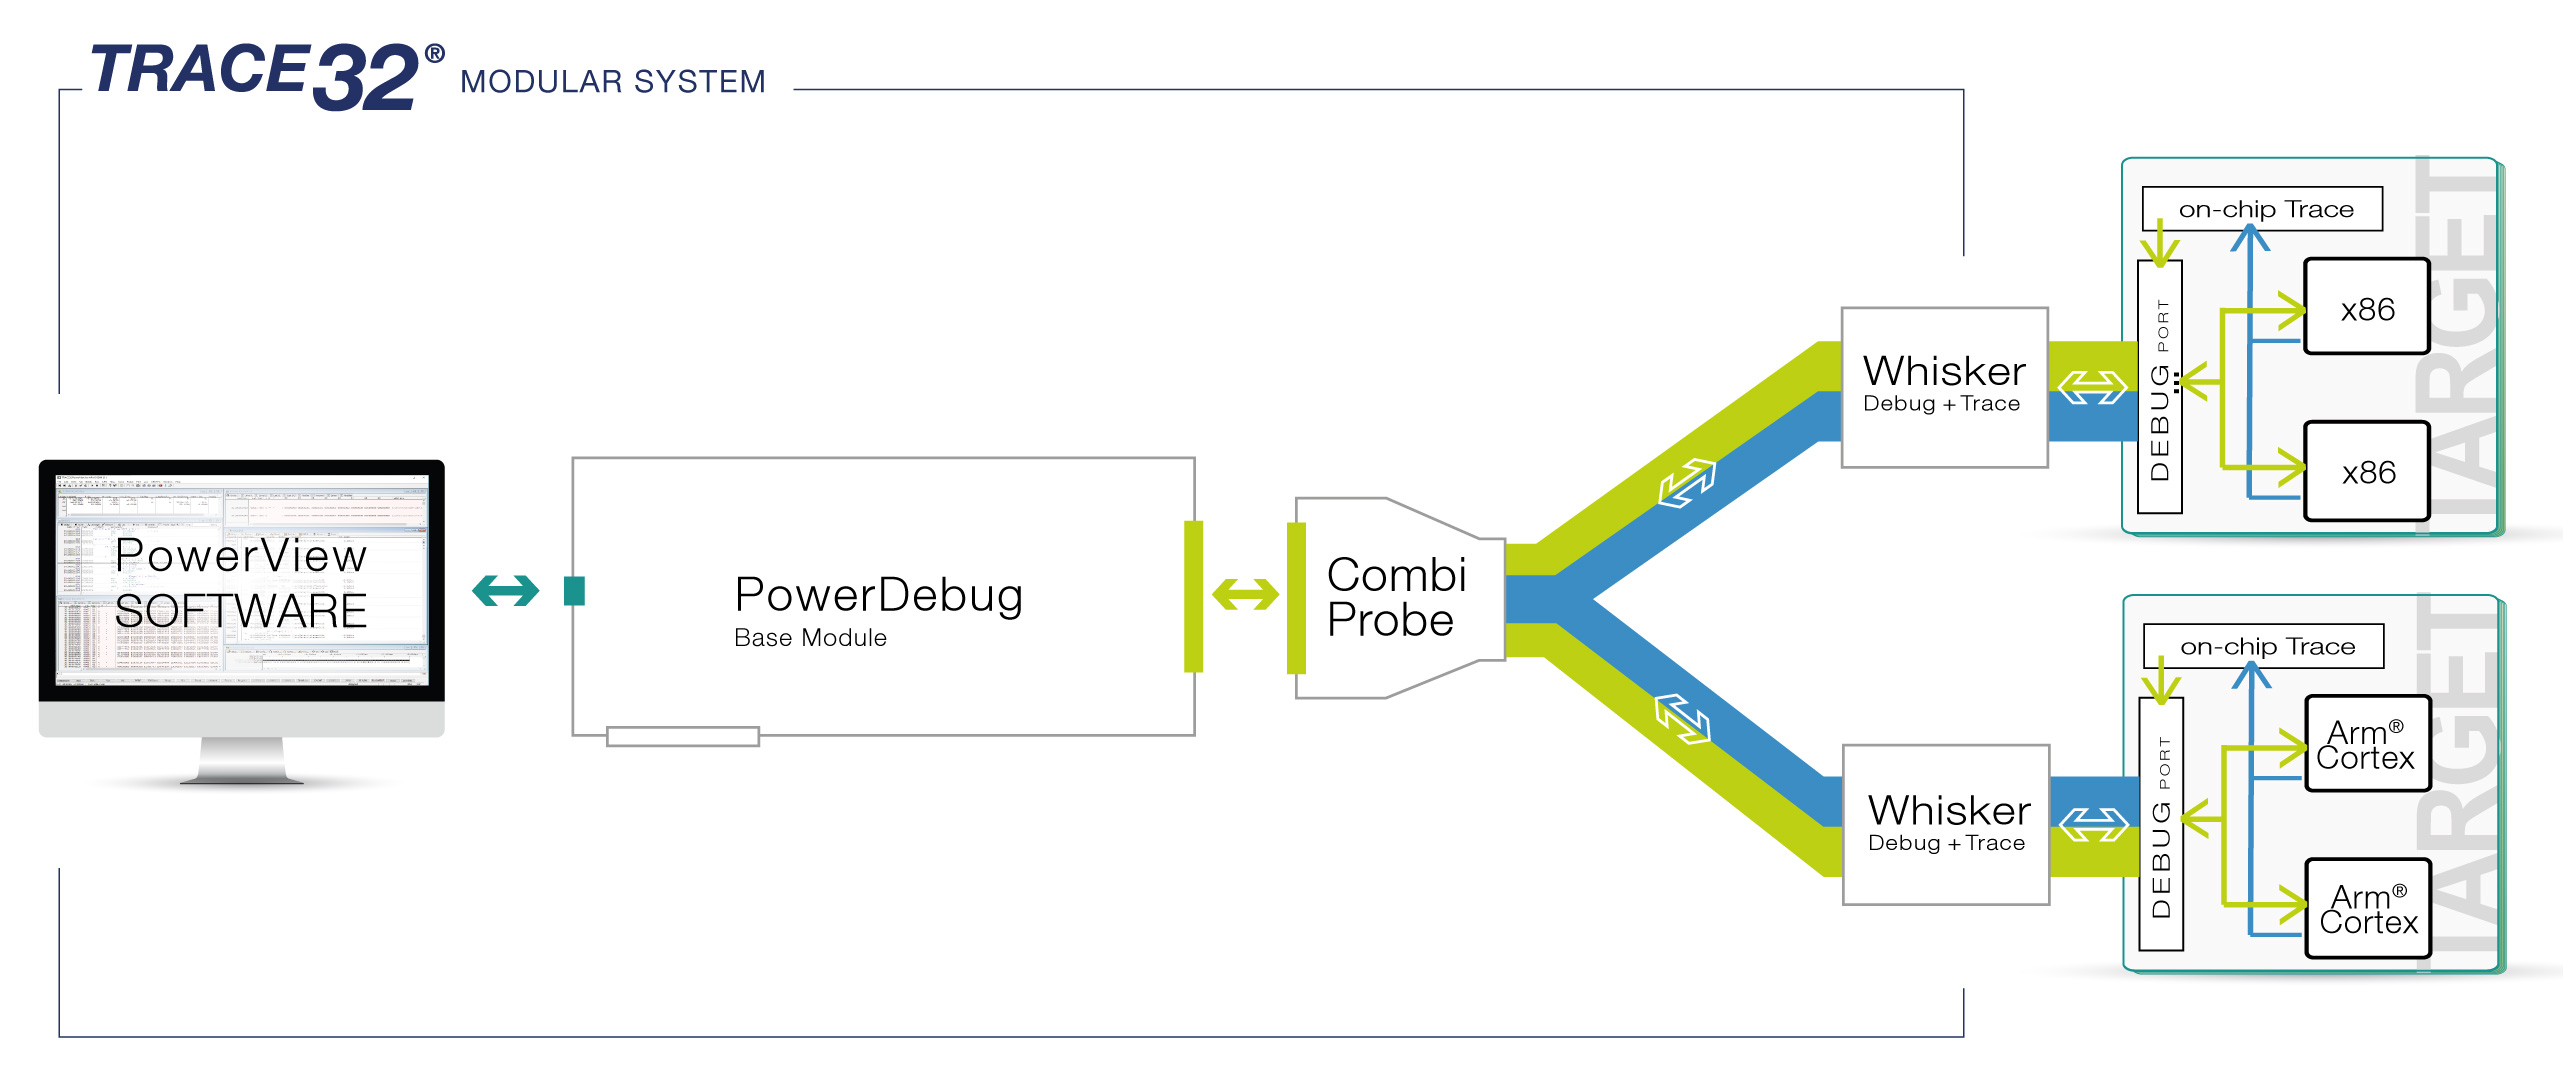
Capture Your Core Actions on Each Chip
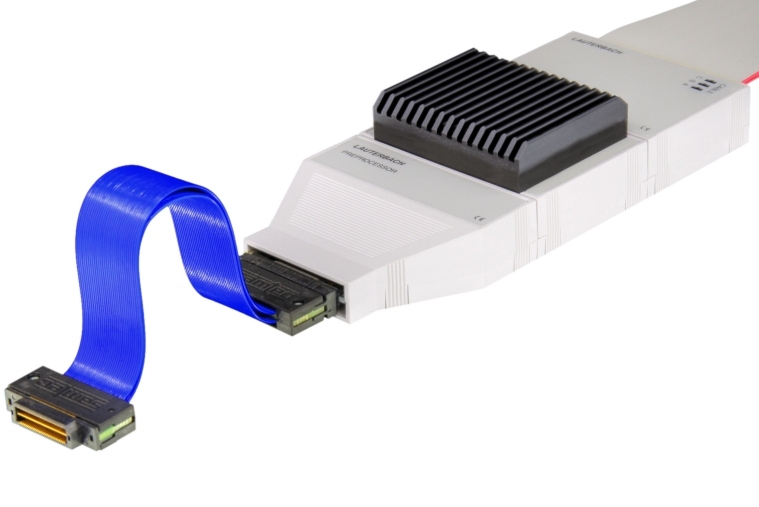
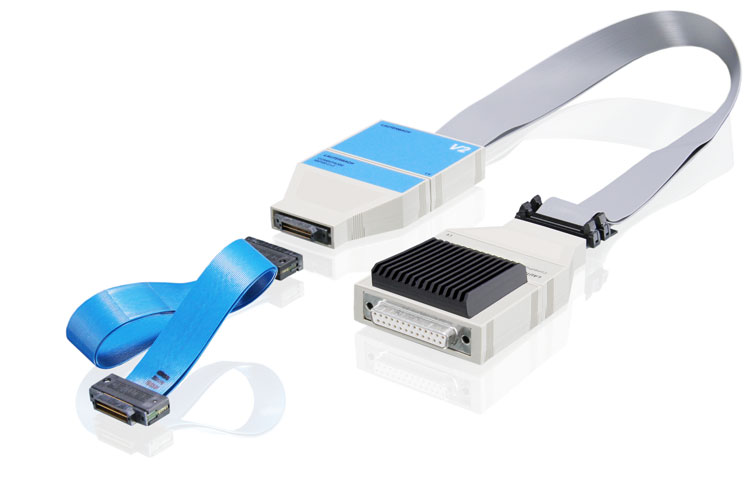
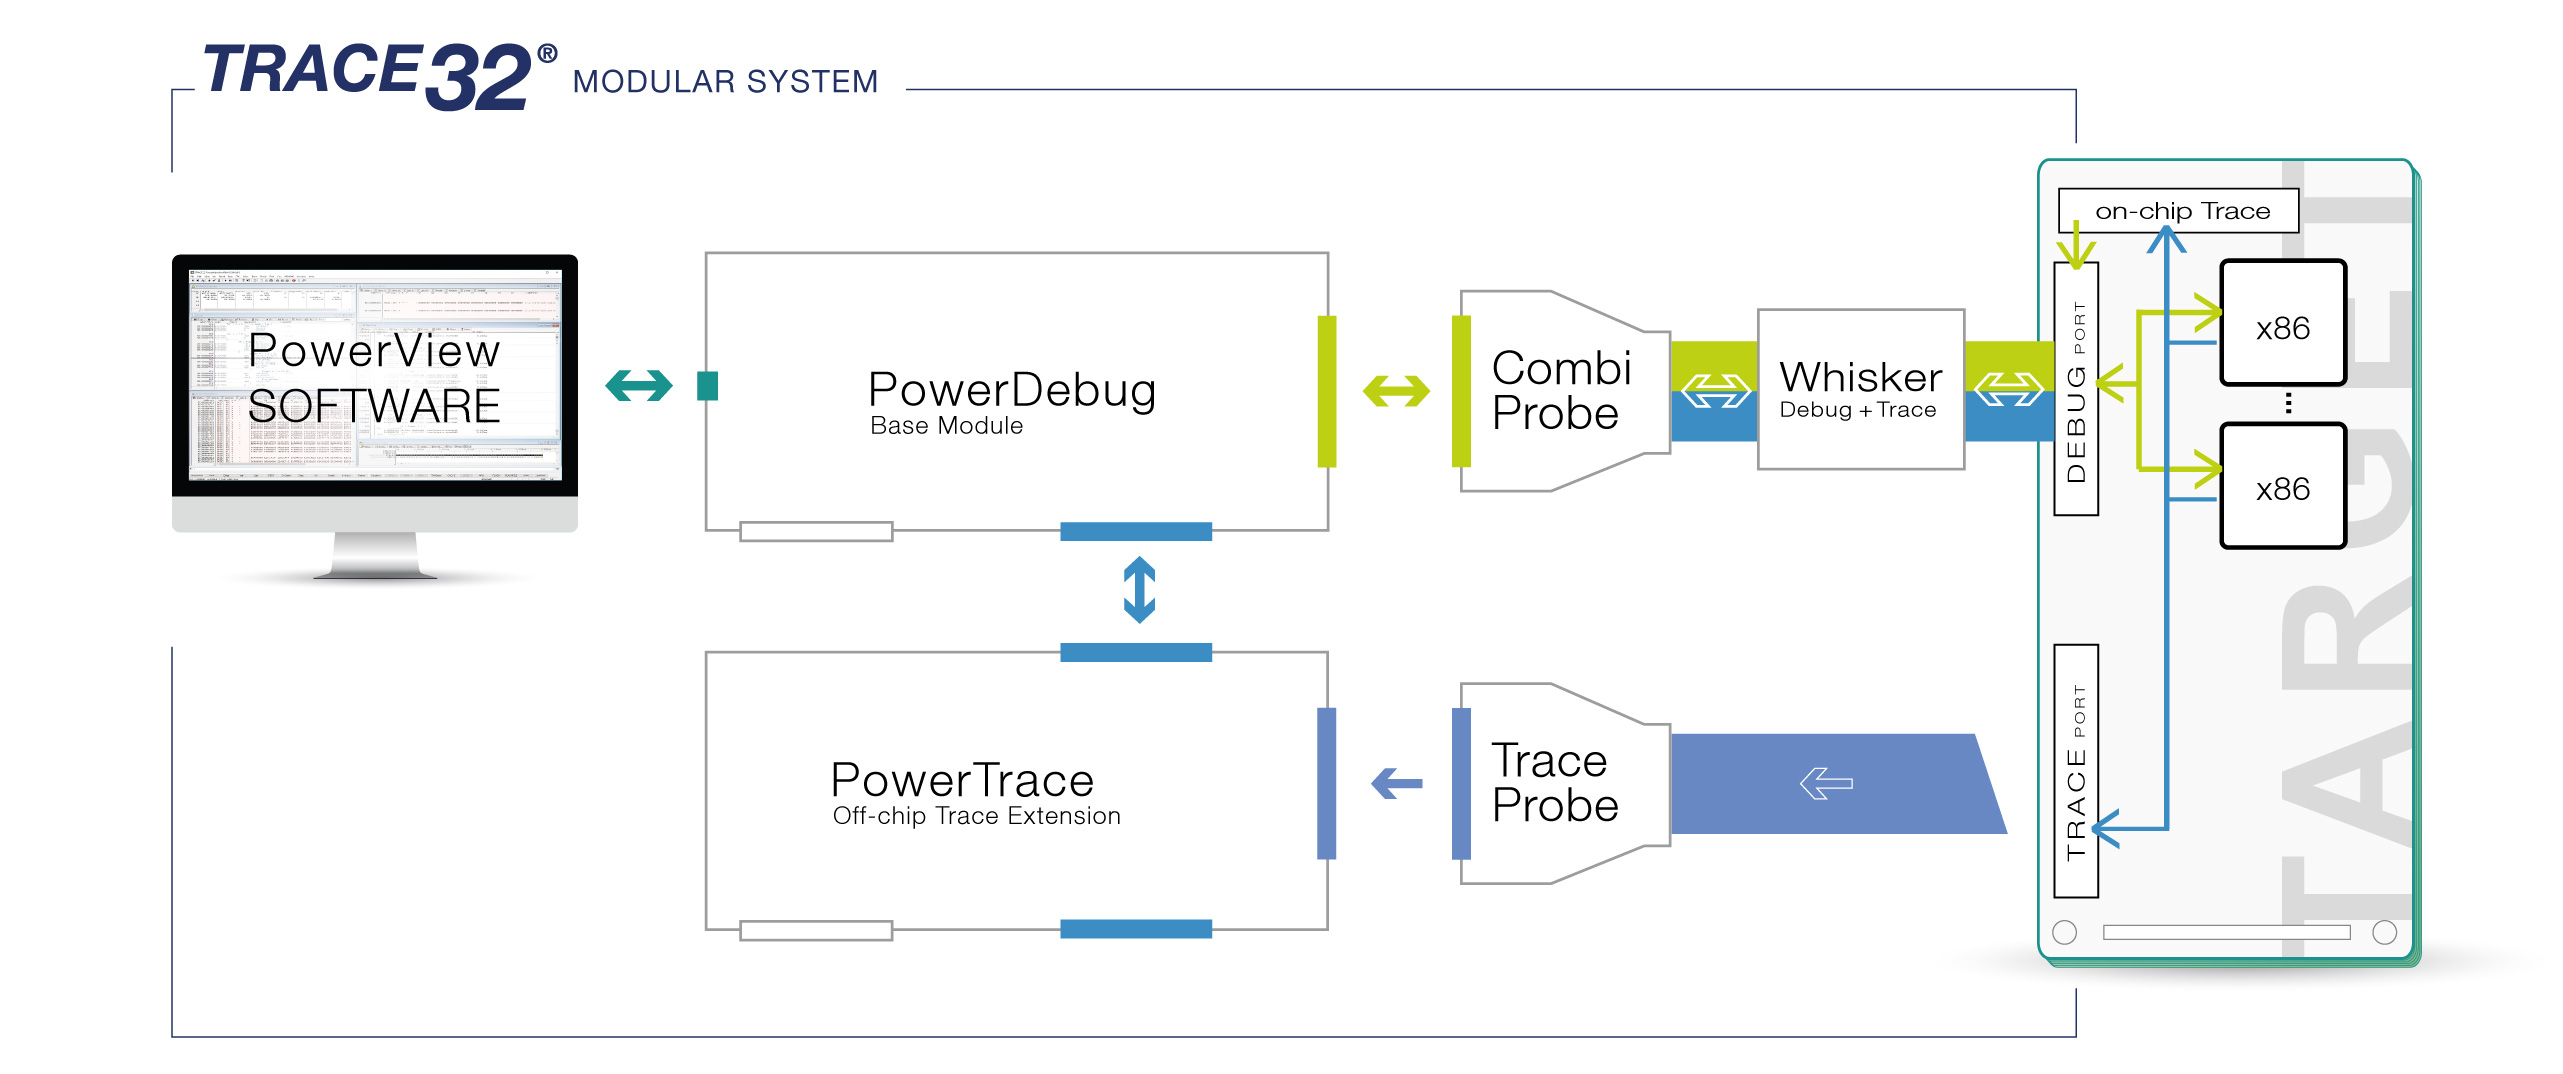
Stop mode debugging can be a powerful tool but tracing is even better. Our trace solutions for support both on-chip trace for various technologies as well as the much more powerful off-chip trace, which can save the trace data inside the target memory or emit it to our PowerTrace tool (off-chip trace on selected platforms).
在您的硅之前做好准备
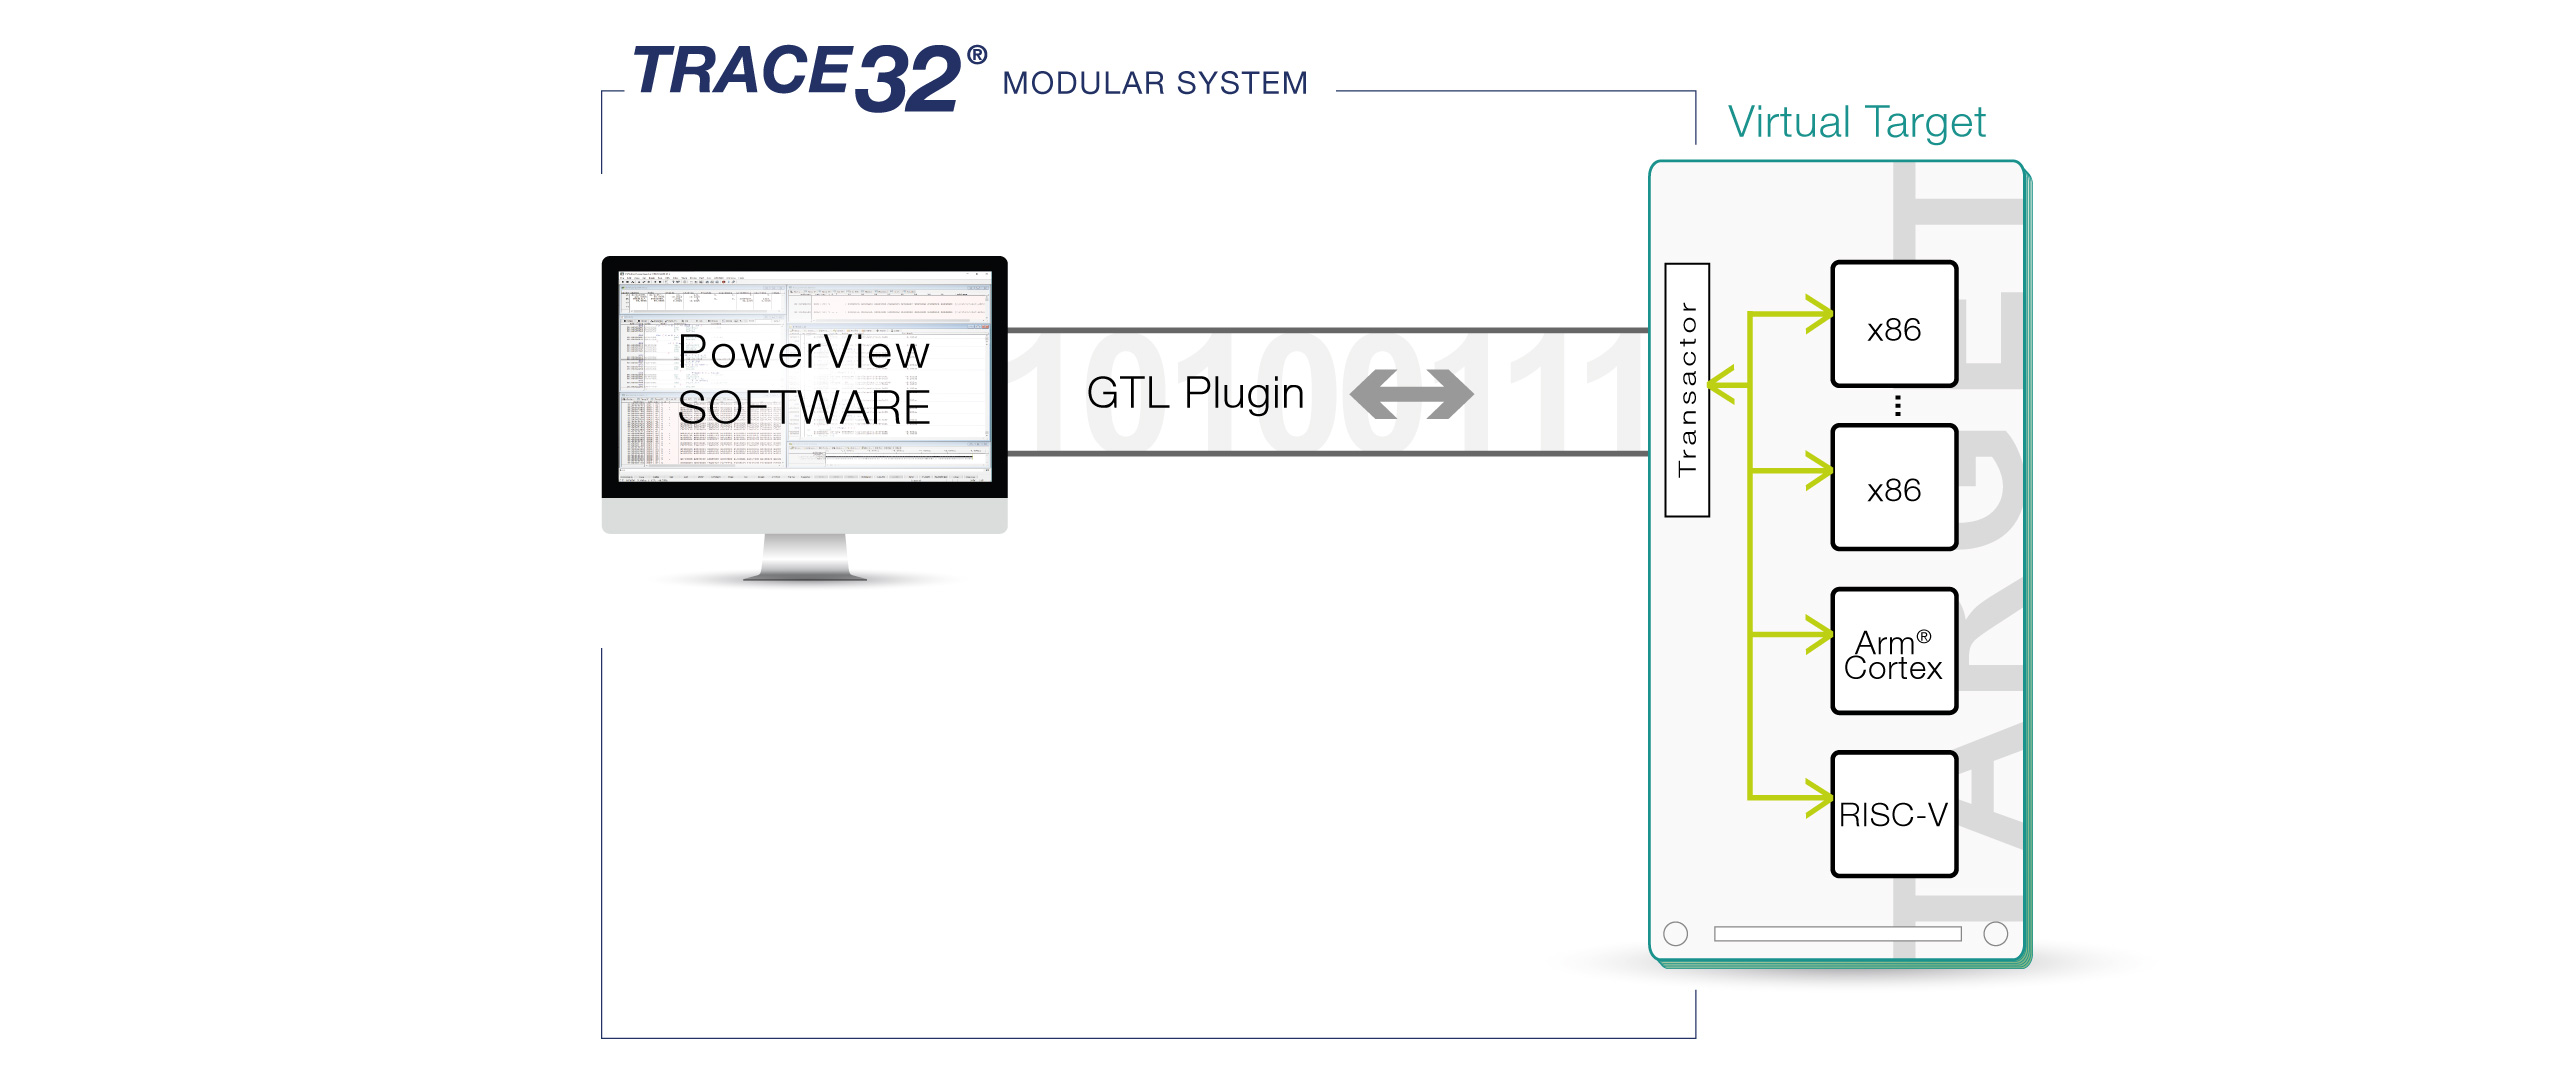
Test your code in your SoC before your SoC is ready. Taping out your SoC takes a lot of time, but TRACE32® allows you to start software development on virtual prototypes and simulators, using the same GUI and toolset that you would use later with the real chip. To some extent it is also possible to verify the debug interface of your individual SoC before starting the taping out.