Intel® 调试器和跟踪

概述

调试和跟踪 Intel SoC 中的任何内核

Analyze any Intel® SoC design implementing both the x86 and other Instruction Sets (ISA), from a single tiny Intel® Quark™ microcontroller to popular chips like Intel Atom®, Pentium® or Celeron® to massive multicore Intel® Core™ or Xeon™ application processors, with our leading edge development tools. Using our TRACE32® tools you can debug and control any x86 core (along with all of the other cores like Arm® Cortex™, Arc™, Xtensa™ and even 8051) in any SoC via a single debug interface, all at the same time. TRACE32® tools support real-time on- and off-chip tracing.

支持的分区架构

酷睿®、至强®、凌动®、奔腾®、赛扬®、i486、i386、i286、i186

调试要点

利用英特尔 SoC 的所有调试功能

By using our powerful debug modules you can apply our full debug feature set to any Intel® SoC. Utilize full on-chip breakpoint support, run-time memory access, flash programming, benchmark counters, MMU and Hypervisor support. Everything is scriptable, which enables you to automate tests very easily.

进一步了解我们的调试系统 
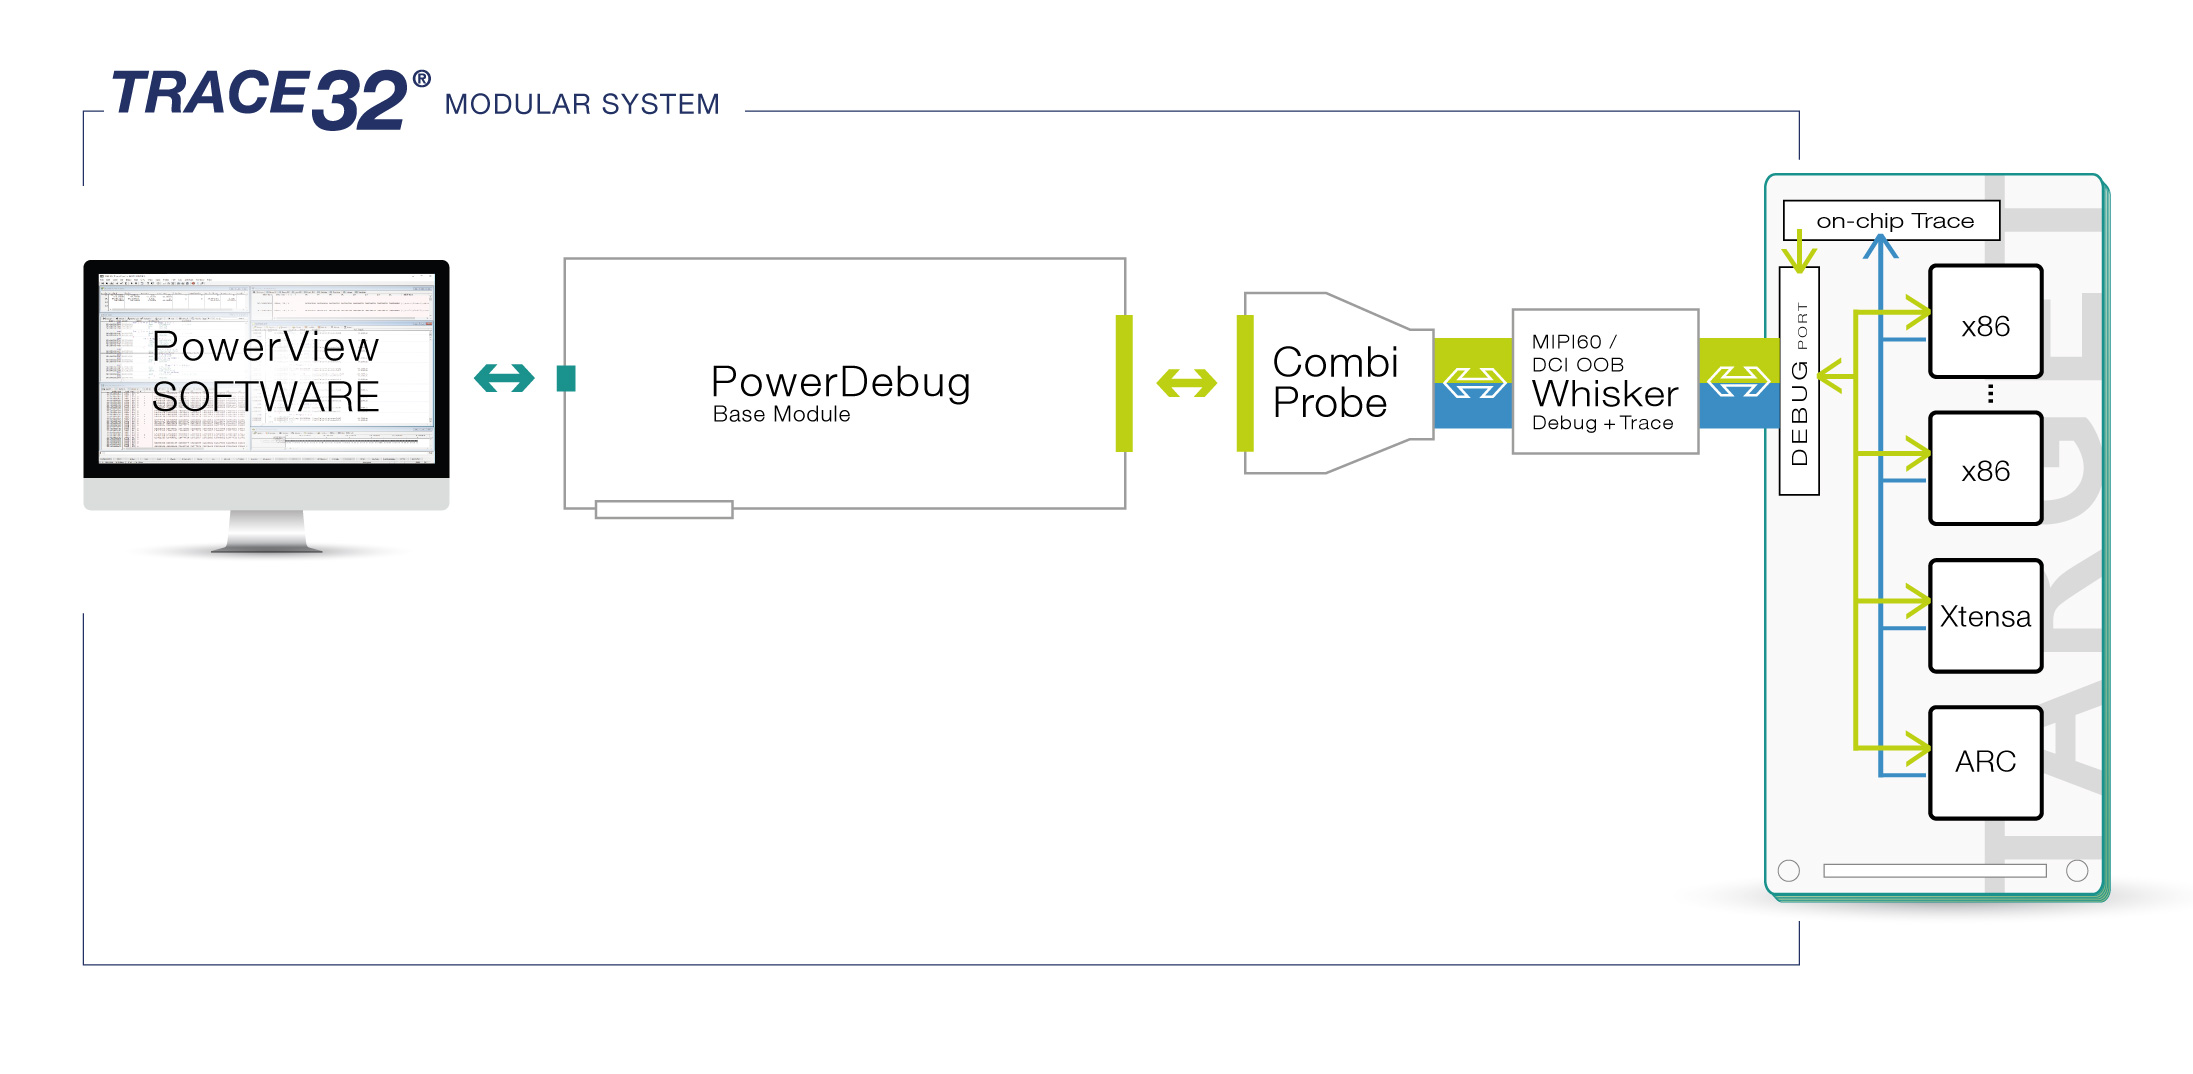
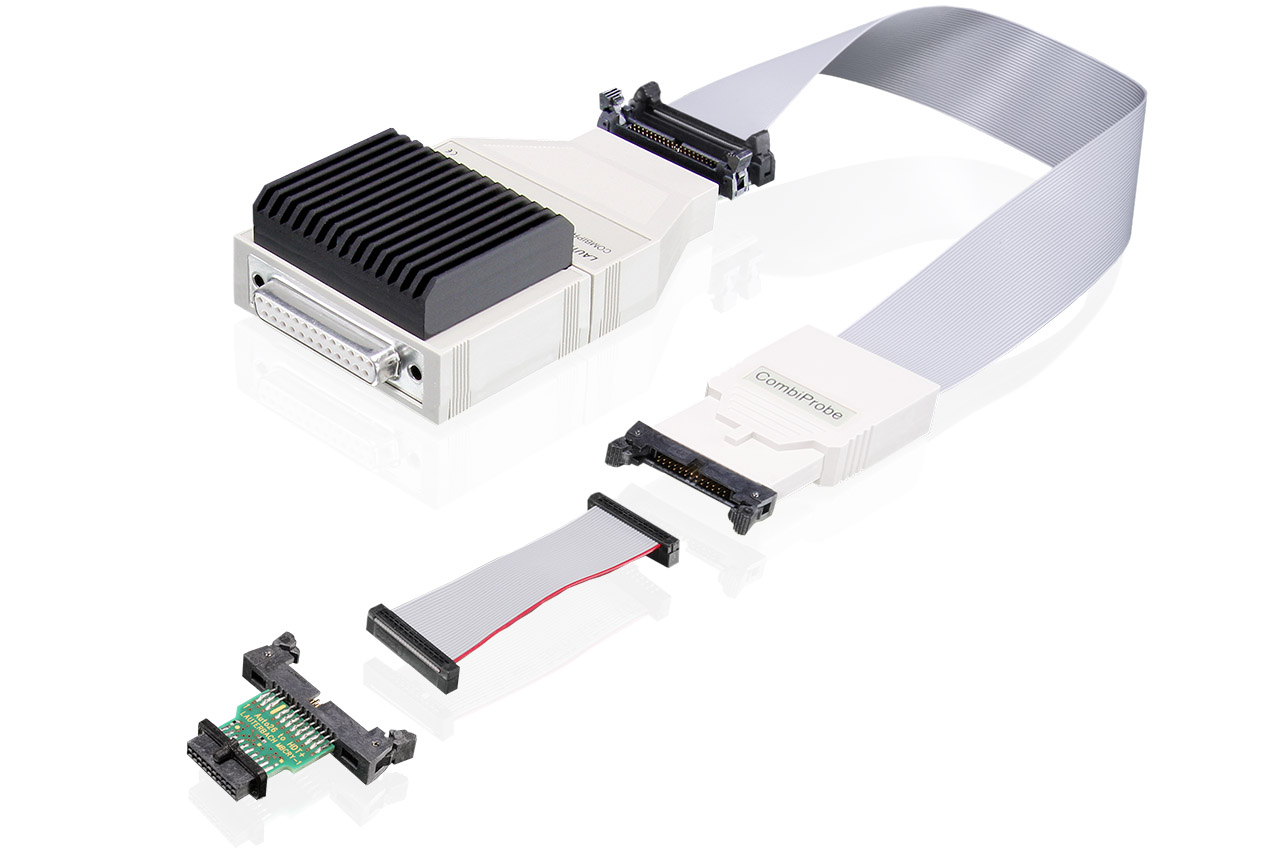
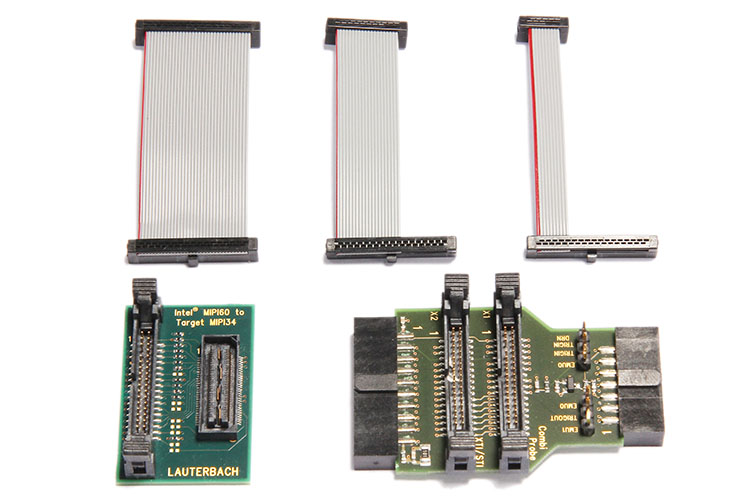
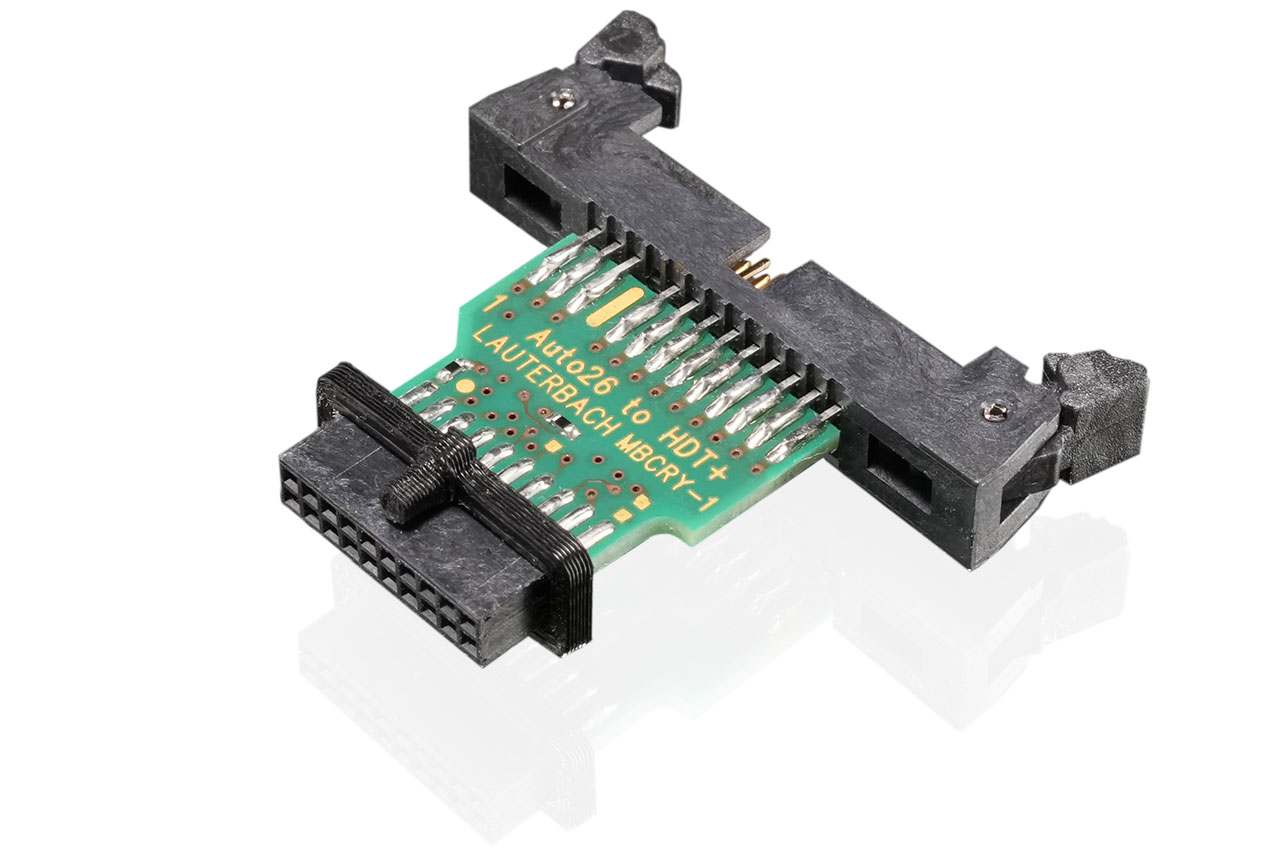
英特尔_whisker-1
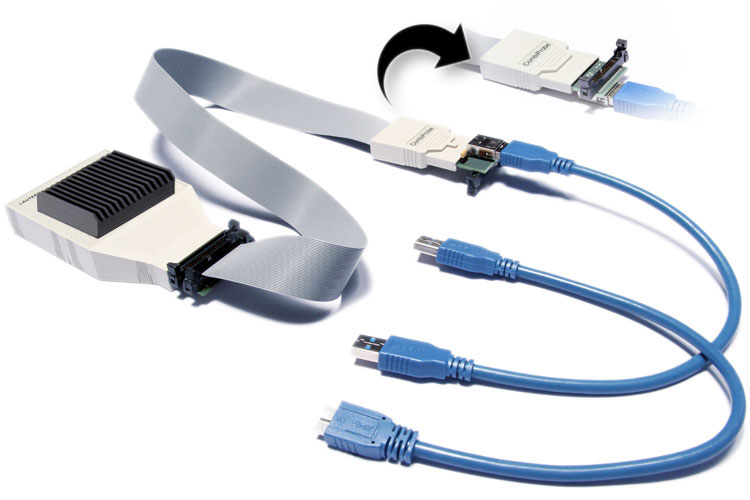
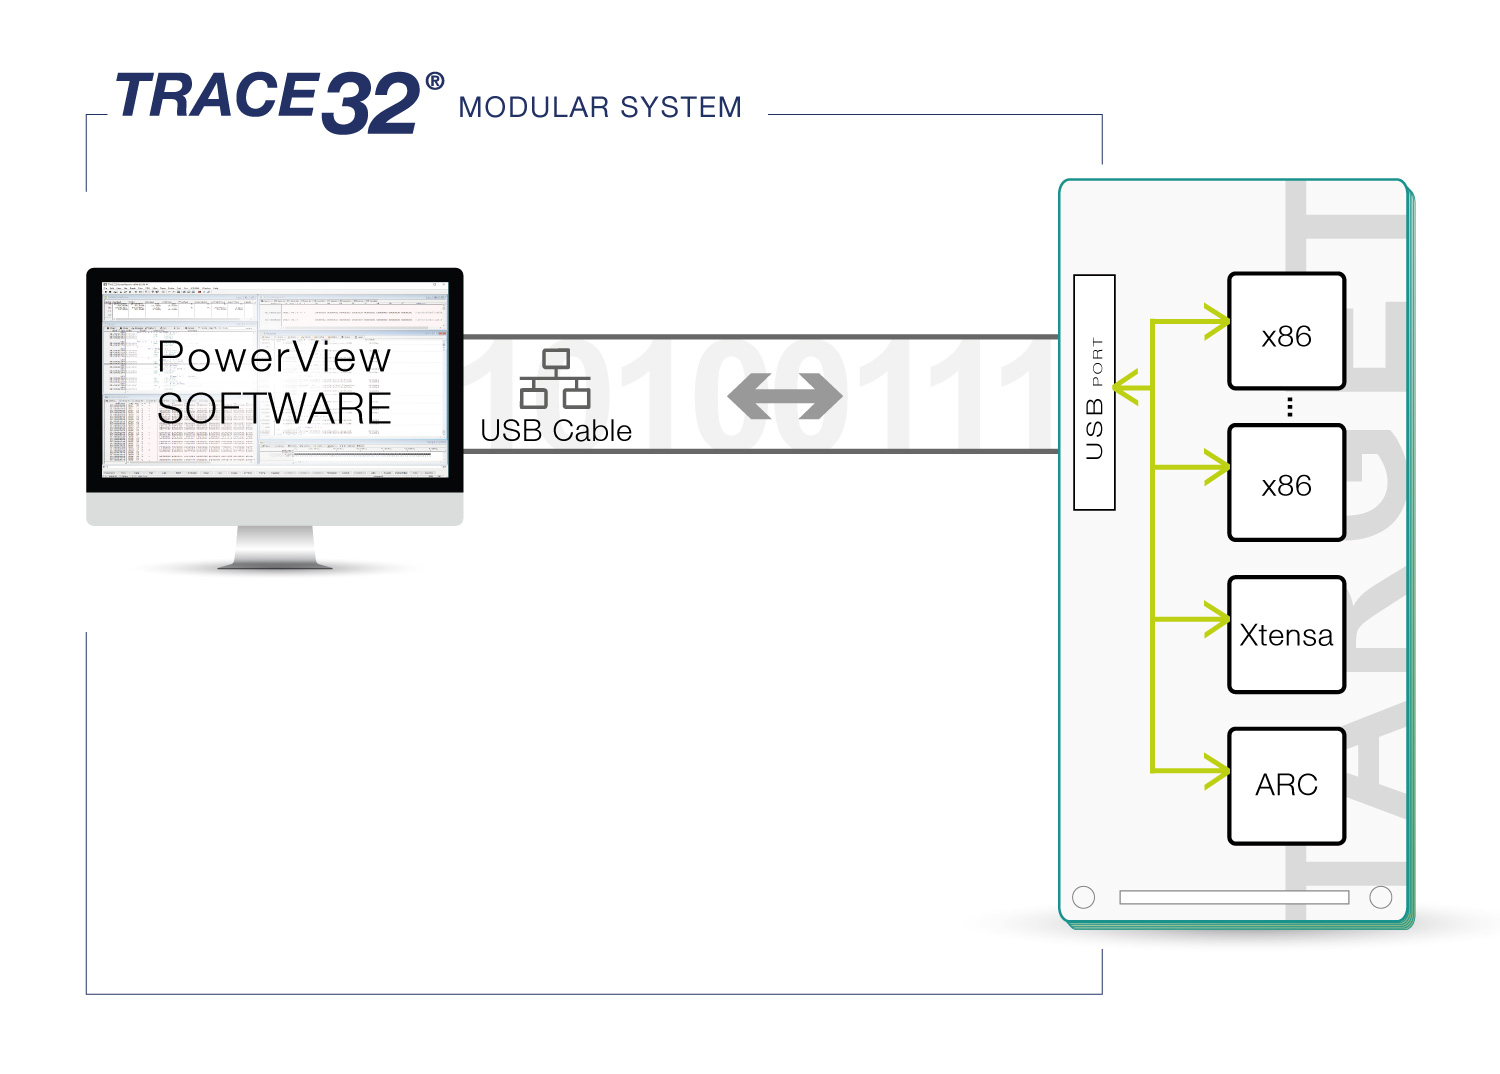
Intel_software-only-debug_(1)

支持任何英特尔调试接口协议

通过传统 JTAG 或 USB 调试。TRACE32® 调试工具支持 USB DCI-OOB 和纯软件 USB DCI-DbC 协议。

享受基于图形用户界面和高级语言的调试

我们的PowerView 软件提供复杂易用的图形用户界面和基于命令行的调试。此外,它还完全支持高级语言调试 (HLL),让您有时间考虑整体逻辑而不是程序代码。

调试多个架构 Intel SoC

只需一个debug probe ,即可同时调试所有 x86 内核和/或非 x86 内核。除 x86 内核外,我们还支持对称(SMP,包括超线程)或非对称(AMP)多处理环境中的 Arm® Cortex、Arc®、Xtensa®、8051 和其他内核。

调试整个软件栈

适用于许多流行的目标操作系统,如 UEFI™、Linux™、Windows™、AUTOSAR 等。TRACE32® 操作系统感知调试可查询和显示所有操作系统对象,如线程、消息队列等。我们还支持多操作系统环境下的Hypervisor 感知调试。

跟踪功能

捕捉您在每个英特尔上的核心操作芯片

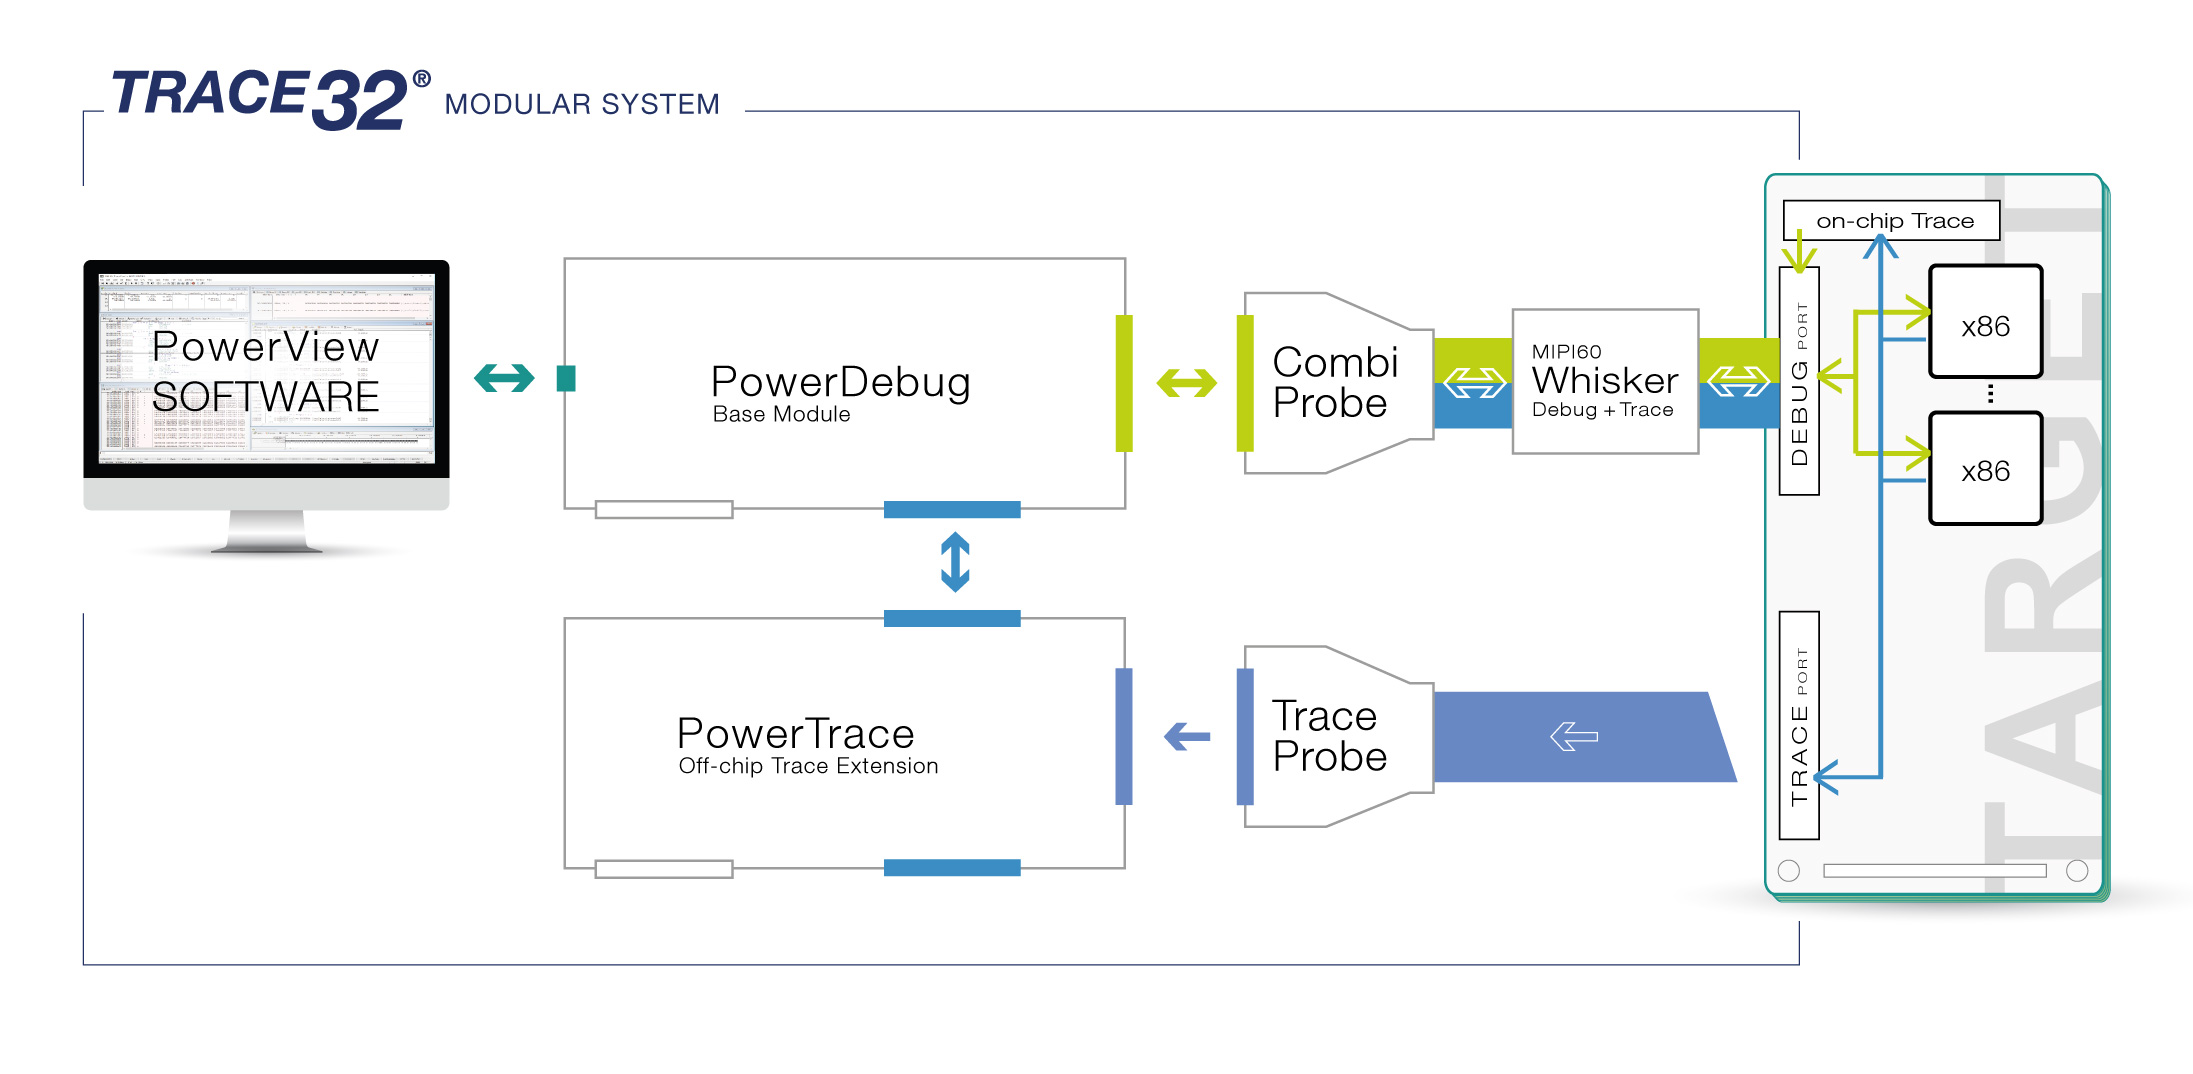
Stop mode debugging can be a powerful tool but tracing is even better. Our trace solutions for Intel® support both on-chip trace for various technologies as well as the much more powerful off-chip trace, which can save the trace data inside the target memory or emit it to our PowerTrace tool.
进一步了解我们的跟踪系统  


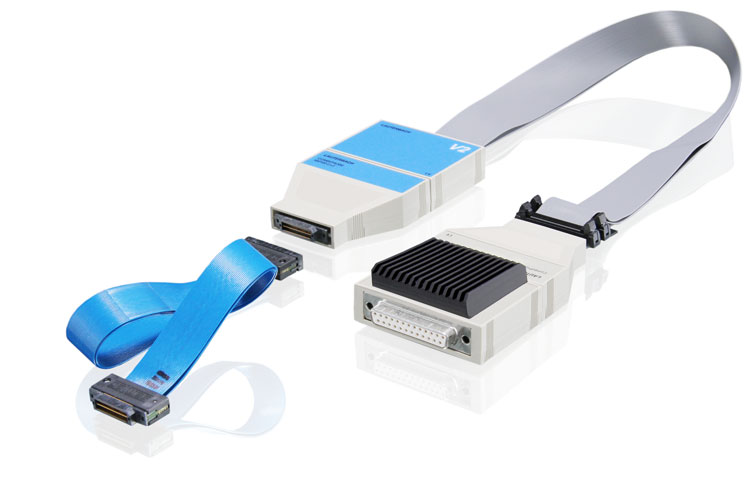
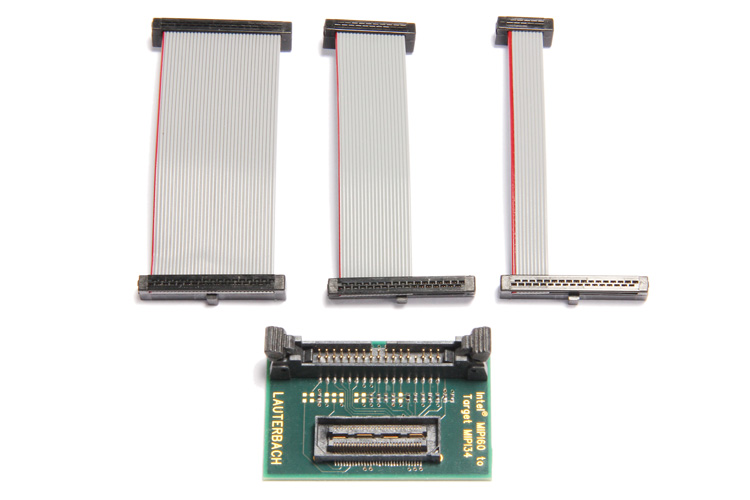
英特尔_whisker-2

Providing highest performance for Off-Chip-Trace

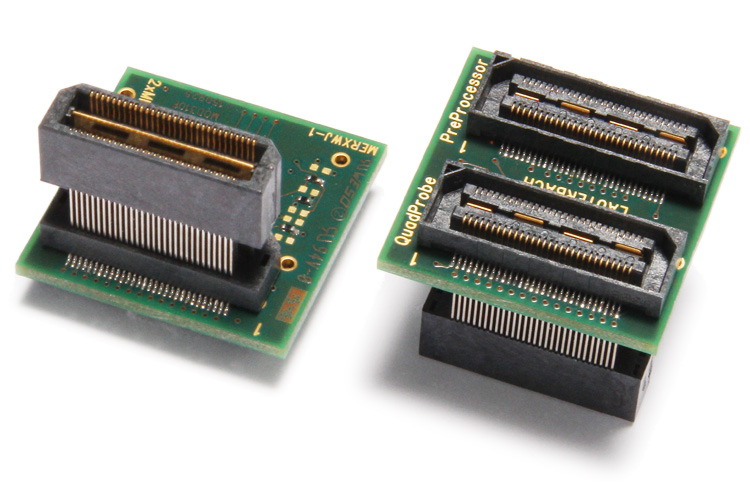
我们的 PowerTrace 模块与英特尔预处理器相结合,可提供来自Intel® SoC 的最高性能的跟踪数据,丝毫不会影响系统的实时性能,并可对沿途的每一步进行记录。根据所使用的芯片 ,您可以立即使用我们的 TRACE32®PowerView 软件或 Intel System Studio 开始检查数据。

Support of All Intel On-Chip Trace Solutions

Our TRACE32® tools support every Trace solution which could be implemented in your Intel® SoC: The Basic On-Chip Trace (LBR), the Advanced On-Chip Traces (Processor Trace PT and Branch Trace Store BTS) and the Arm CoreSight™ trace infrastructure. Besides your already existing debug module there is no additional trace hardware required.

分析多个磁芯之间的相互作用

我们的跟踪解决方案支持多核跟踪,以记录和分析内核之间的动态交互。对于混合架构 Intel® SoC,您可以同时跟踪 x86 和非 x86 内核。

获取详细的运行时信息

我们的跟踪解决方案可以记录 SoCs 跟踪 IP 提供的完整程序流程。根据记录的数据,您可以执行详细的时序测量。

虚拟原型

在您的硅之前做好准备

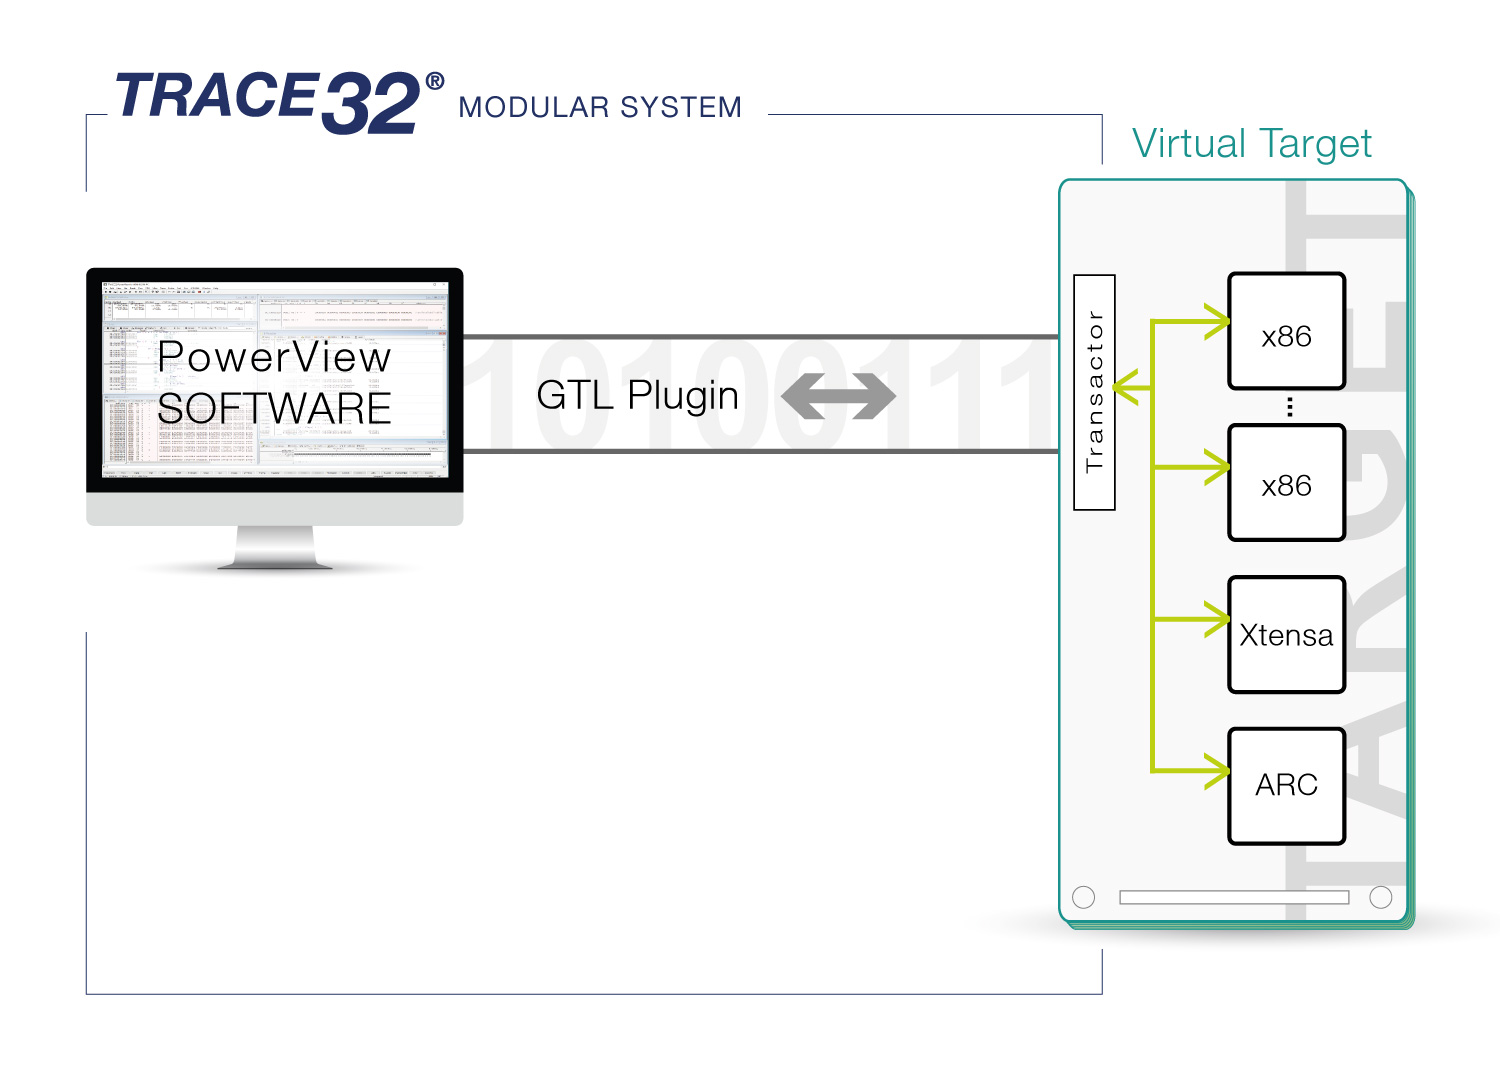
在 SoC 准备就绪之前,在Intel® SoC 中测试代码。将您的SoC编译出来需要大量时间,但TRACE32®允许您在虚拟原型和模拟器上开始软件开发,使用与您以后在真正的芯片 。在某种程度上,您也可以在开始分接之前验证单个 SoC 的调试接口。
进一步了解我们的跟踪系统  


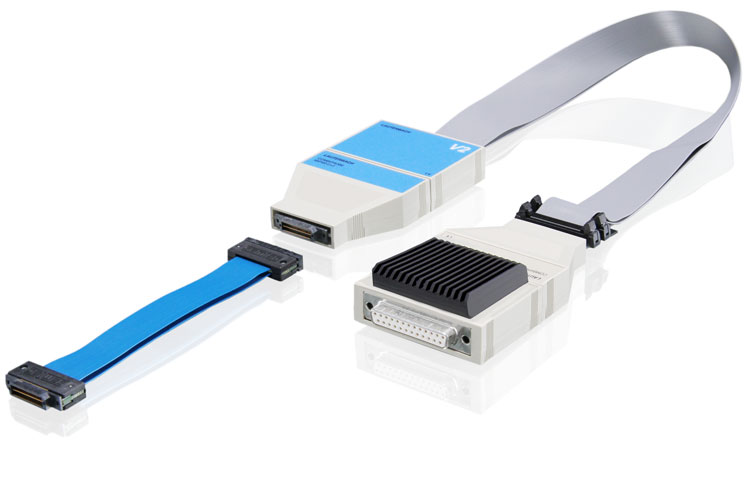
Intel_software-only-emulator_(1)

使用集成指令集进行单元测试Simulator

TRACE32®PowerView 提供内置指令集simulator ,非常适合模块和回归测试。

执行硅前验证

使用仿真的 Verilog 或 VHDL 网表,在分接之前验证 SoC(包括调试机制)。劳特巴赫通用处理程序库(GTL)允许您在 JTAG 层面上执行硅前除错。

工具链支持

英特尔支持的第三方工具

Bootloader (5)
产品
公司
核心启动
GRUB
UEFI Aptio V
UEFI InsydeH2O
UEFI 英特尔 BLDK/UDK

TRACE32 支持的所有架构 都具有以下功能。如果此处未列出您的设备或工具,请与我们联系;支持通常已经在路上。

Host 操作系统

我们的调试软件可在所有主流操作系统上运行。

Flash 设备

我们支持对各种闪存设备进行编程。NOR、NAND、SPI、QSPI、EMMC 等。

第三方集成

通过集成,您可以轻松地将TRACE32 与其他工具结合使用。

相关产品

TRACE32 英特尔相关产品

筛选条件

筛选条件
找到 22 个产品