CEVA-X 调试和跟踪解决方案
任何 SoC 中的任何 CEVA-X 内核
受益于劳特巴赫领先的开发工具和与 CEVA® 的紧密合作关系,可以分析任何设计,从独立的单核或多核器件到复杂的 SoC。
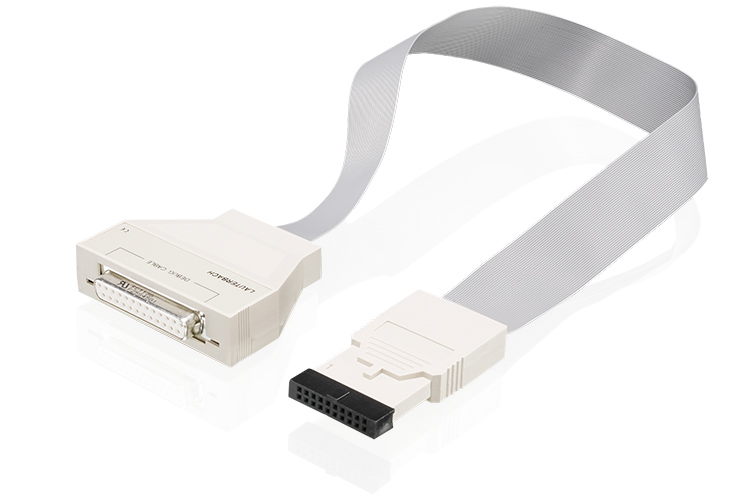
CEVA-XTM DSP cores are a popular choice for multi-gigabit baseband network processing, machine vision, deep learning, and wireless applications. Using our TRACE32® tools you can debug and control any CEVA-XTM core (along with all of the other cores) in any SoC via a single debug interface, all at the same time. TRACE32® supports the complete feature set CEVA-XTM cores like CEVA-XCTM, CEVA-XMTM, SensProTM, and many others. For chips implementing Arm’s CoreSight IP, TRACE32® tools support real-time on- and off-chip tracing.
支持的分区架构
Ceva X16xx、Ceva X1/X2、Ceva BX/XC/XM
利用所有调试功能
Explore and utilize all the powerful and well-known features of your CEVA-X™ core with Lauterbach debug modules: full on-chip breakpoint support; run-time memory access; flash programming and benchmark counters. And of course, everything is scriptable, enabling you to repeat the same test-sequence over and over. The same interface you use for your application core debug can be used for debugging your DSP, reducing training time and allowing you to be more productive, more quickly.
进一步了解我们的调试系统捕捉核心行动
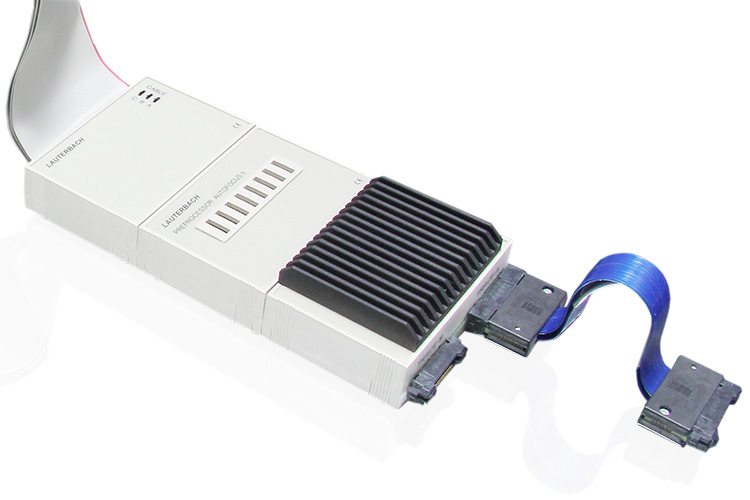
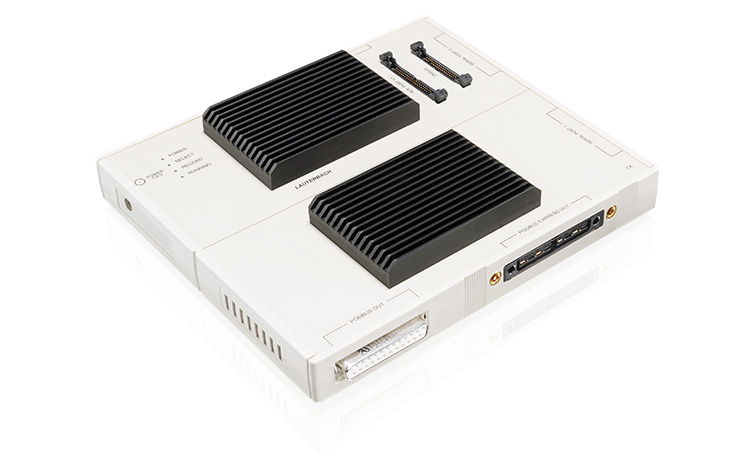
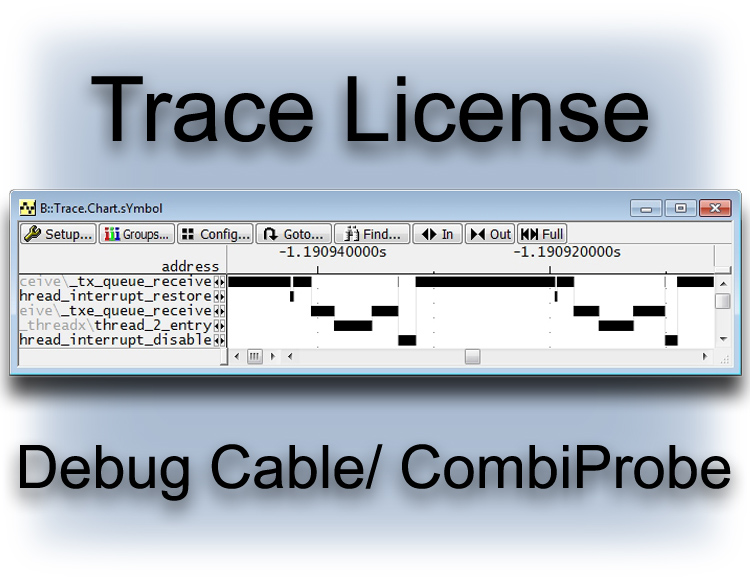
Stop mode debugging can be a powerful tool but tracing is even better. Our trace solutions for CEVA-X™ support both on-chip trace and the much more powerful Arm® ETM® off-chip Trace, which can save the trace-data inside the target memory or emit it to one of our PowerTrace tools. For extended tracing, the ETM off-chip trace provides large volumes of trace data and the capability of recording for minutes, hours, or days using trace streaming.
在您的硅之前做好准备
在您的SoC准备就绪之前,在您的定制SoC中测试您的CEVA-X™代码。测试您的 SoC 需要大量时间,但 TRACE32® 允许您在仿真器上开始软件开发,使用与您以后在真正的芯片 上使用的相同图形用户界面和工具集。
CEVA-X 支持的第三方工具
TRACE32 支持的所有架构 都具有以下功能。如果此处未列出您的设备或工具,请与我们联系;支持通常已经在路上。
Host 操作系统
我们的调试软件可在所有主流操作系统上运行。
Flash 设备
我们支持对各种闪存设备进行编程。NOR、NAND、SPI、QSPI、EMMC 等。
第三方集成
通过集成,您可以轻松地将TRACE32 与其他工具结合使用。


