TRACE32® AI
Accelerate Your Innovations with TRACE32® AI
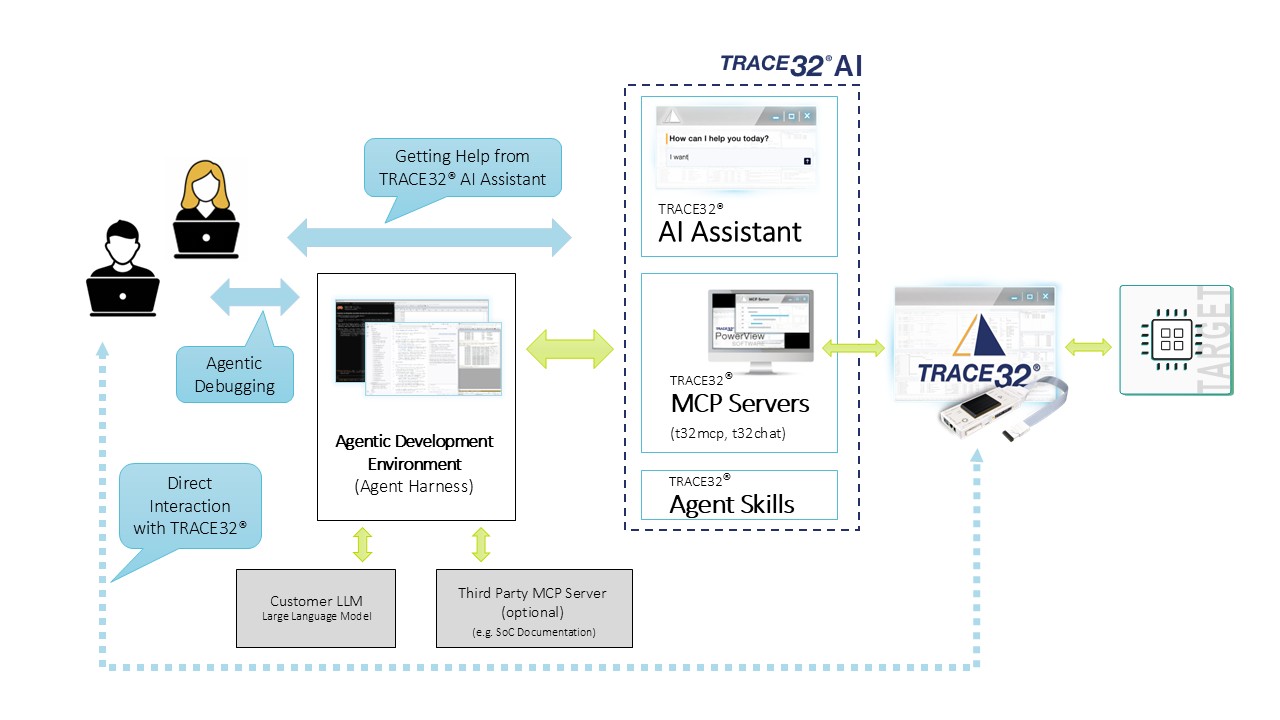
TRACE32® AI brings artificial intelligence to our market-leading development tools, helping you analyze systems faster, find errors sooner, and work more productively on complex embedded projects. It utilizes the entire market-leading TRACE32® feature set, supports emulators, simulators, virtual and real targets and comprises three components: the AI Assistant for faster answers and creating automation scripts, TRACE32® MCP Servers for automated debugging, and a seamless integration into third-party IDEs. Together they save significant effort and accelerate your time-to-market.
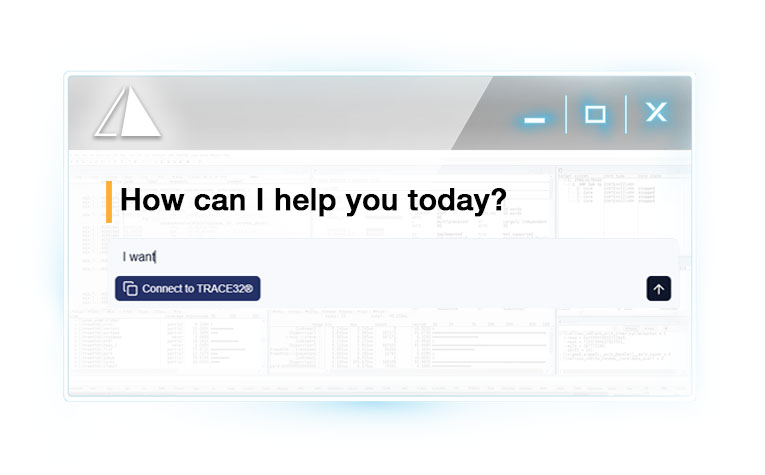
Your Smart Debug Partner: The TRACE32® AI Assistant
Get answers from the entire TRACE32® knowledge base, understand commands, and create, edit or explain PRACTICE scripts—all through a familiar chat interface. Your AI partner for debugging and test automation is delivering our expertise at your fingertips.
Register to AccessExplain, Create and Edit Automation Scripts Easily
Accelerating the development process and shorten time-to-market is essential for everyone. Your TRACE32® AI Assistant supports you in speeding-up by creating PRACTICE automation scripts on your request. Tell the assistant what you want the script to do, and it will program it for you from the scratch or edit/extend existing ones. It can also explain existing scripts.
.
“Fix My Bug”: Debugging on Autopilot with TRACE32® AI
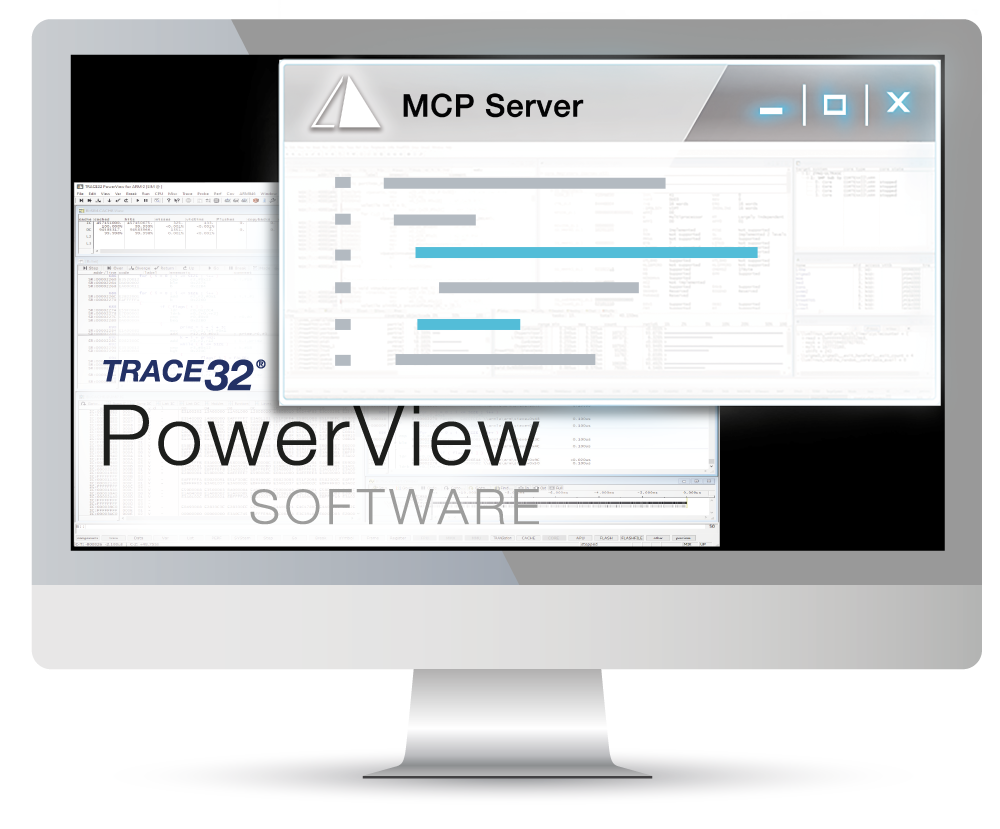
Connect TRACE32® to AI tools like Claude Code with our open-source MCP server. Built-in scripts and expert knowledge help your AI agent investigate bugs, run debugging tasks, and plan next steps—from multicore debugging to coverage and timing analysis. Extend it with your own scripts and share them on GitHub.
More information about predefined PRACTICE scripts for low-level debugging
Predefined Skill-Files enable immediate TRACE32 AI support among others for the 3 most relevant low level debug operations:
1. Core run control
Attach/detach, reset (hardware/software, halt on reset) Go/halt/step (instruction- and source-level) Hardware/software breakpoints and watchpoints, to stop precisely instead of stepping blindly Synchronized run control and cross-triggering for multicore targets
2. Register and memory access
CPU core, status and system registers Memory read/write, dumps, fill, search (including MMU/MPU translation) Peripheral registers and memory-mapped I/O, read and write
3. Symbol resolution and target awareness
ELF/symbol loading, address ↔ source/variable mapping Stack and call-chain reconstruction OS awareness (tasks, scheduler)
Download from Gitlab
Example: AI Controlled Unit Test
Unit testing on embedded targets takes time: writing test cases, running them on the hardware, collecting test results, and proving that every line of code was executed. TRACE32® AI handles it for you. Just ask, e.g. "Test my function xyz and show me the code coverage.", and TRACE32® AI generates the test cases, runs them on your target, collects the results and - if necessary - changes the code to achieve 100% coverage.
Utilize TRACE32® AI from Your Familiar Development Environment
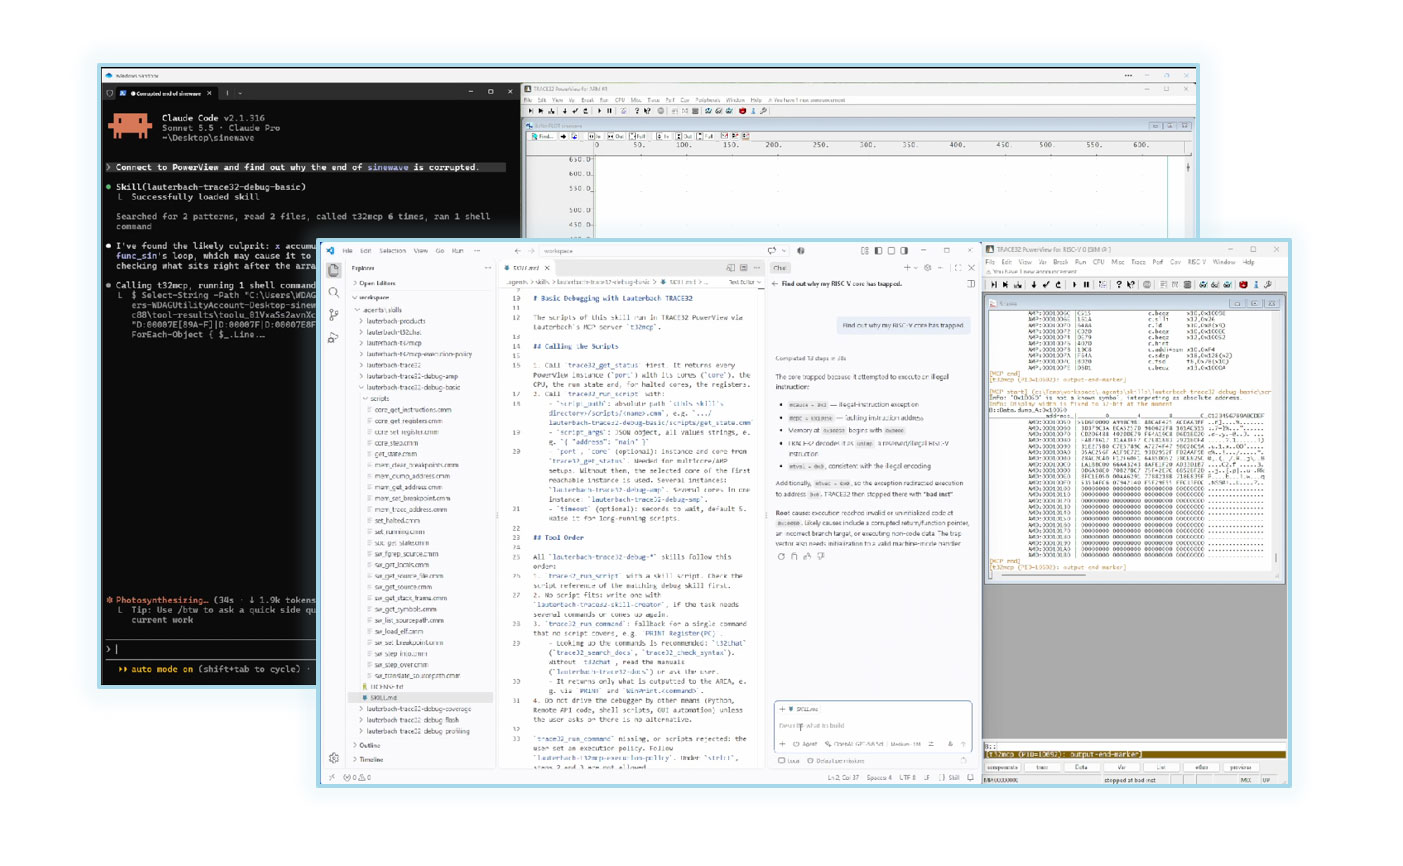
The Debug Adapter Protocol (DAP) server connects TRACE32® to third-party IDEs. Popular IDEs like Visual Studio Code, Claude Code or Mistral Vibe act as a fully functional front end for TRACE32® and give you access to its market-leading debug capabilities without leaving your familiar development environment. The built-in Debug Adapter provides the IDE integration layer alongside the TRACE32® AI Assistant and MCP Server.
TRACE32® AI Within Claude Code
Using TRACE32® AI from Claude Code is also a simple task: By entering just two commands to register the TRACE32® AI MCP server, you get full access to TRACE32® AI from your Claude Code environment.
Download from Gitlab .Your Policies.
Your Control over TRACE32® AI
TRACE32® AI is by far the most powerful AI in the embedded tool industry, utilizing the full TRACE32® feature set including heterogeneous multicore and OS-aware debugging. It can autonomously perform safety-sensitive tasks like erasing flash, resetting the processor, or starting processes in the underlying OS — which may be undesirable in some use cases. The solution: define execution policies. The TRACE32® MCP server can enforce a strict policy that only executes scripts explicitly declared as safe, effectively reducing the agent's control over the target platform.
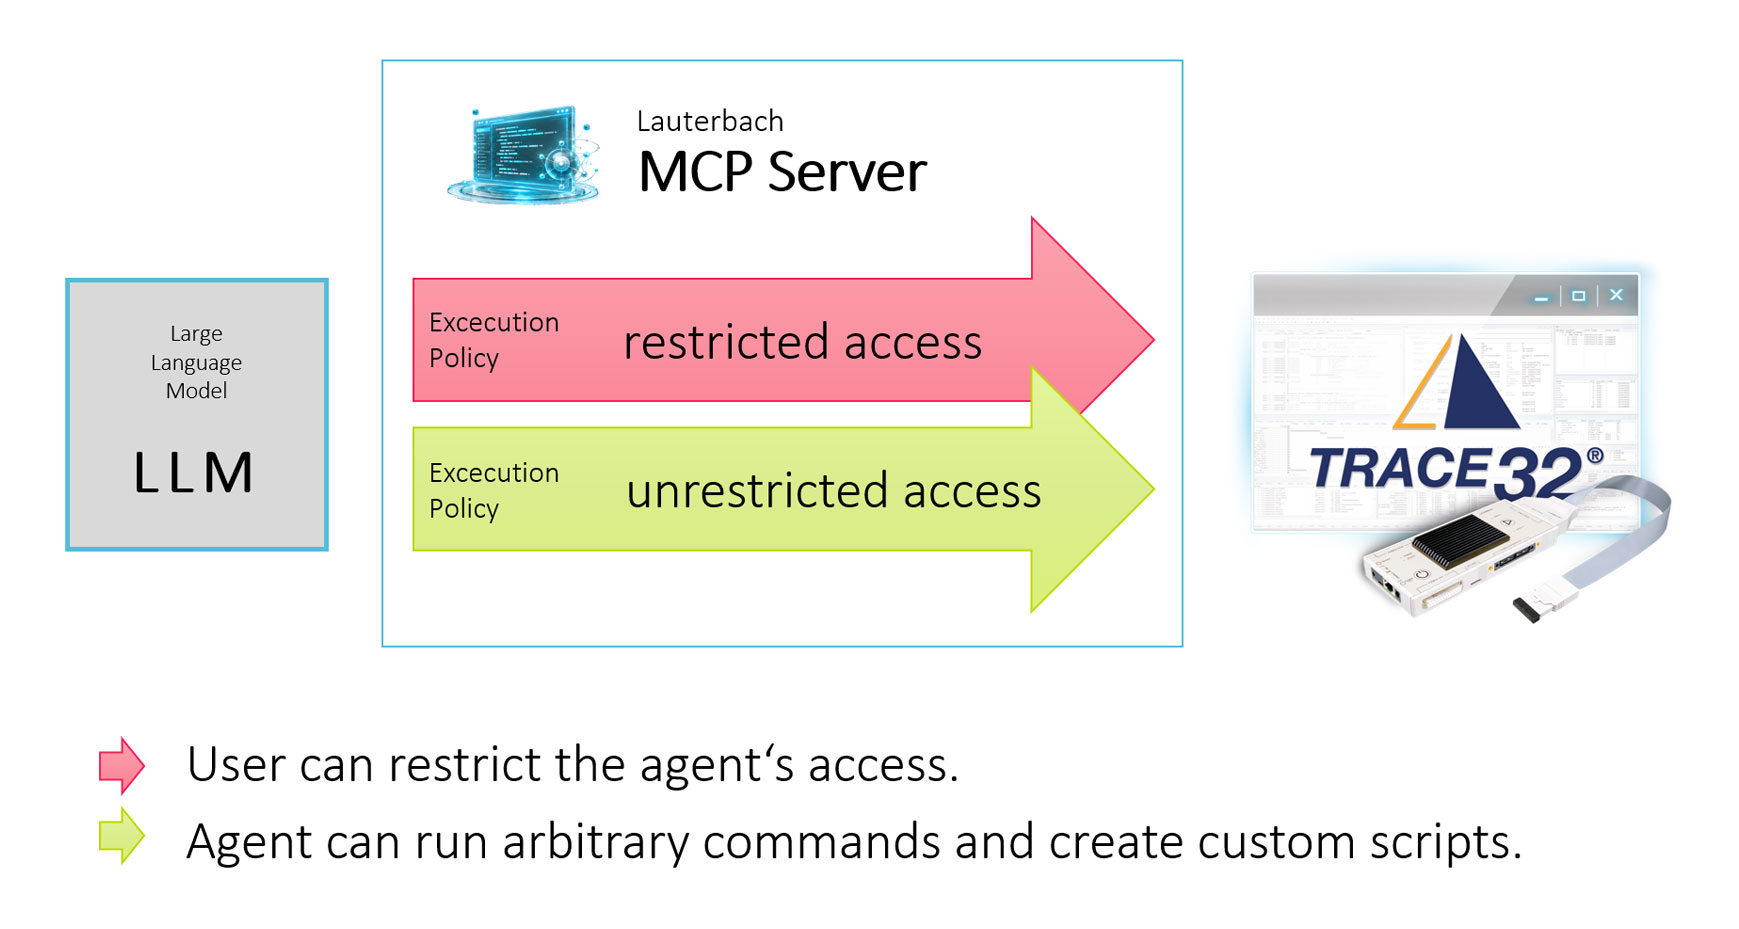
How everything Works:
The Power of TRACE32® AI at a Glance