Debug NXP S32N55 Super Vehicle Integration Processor
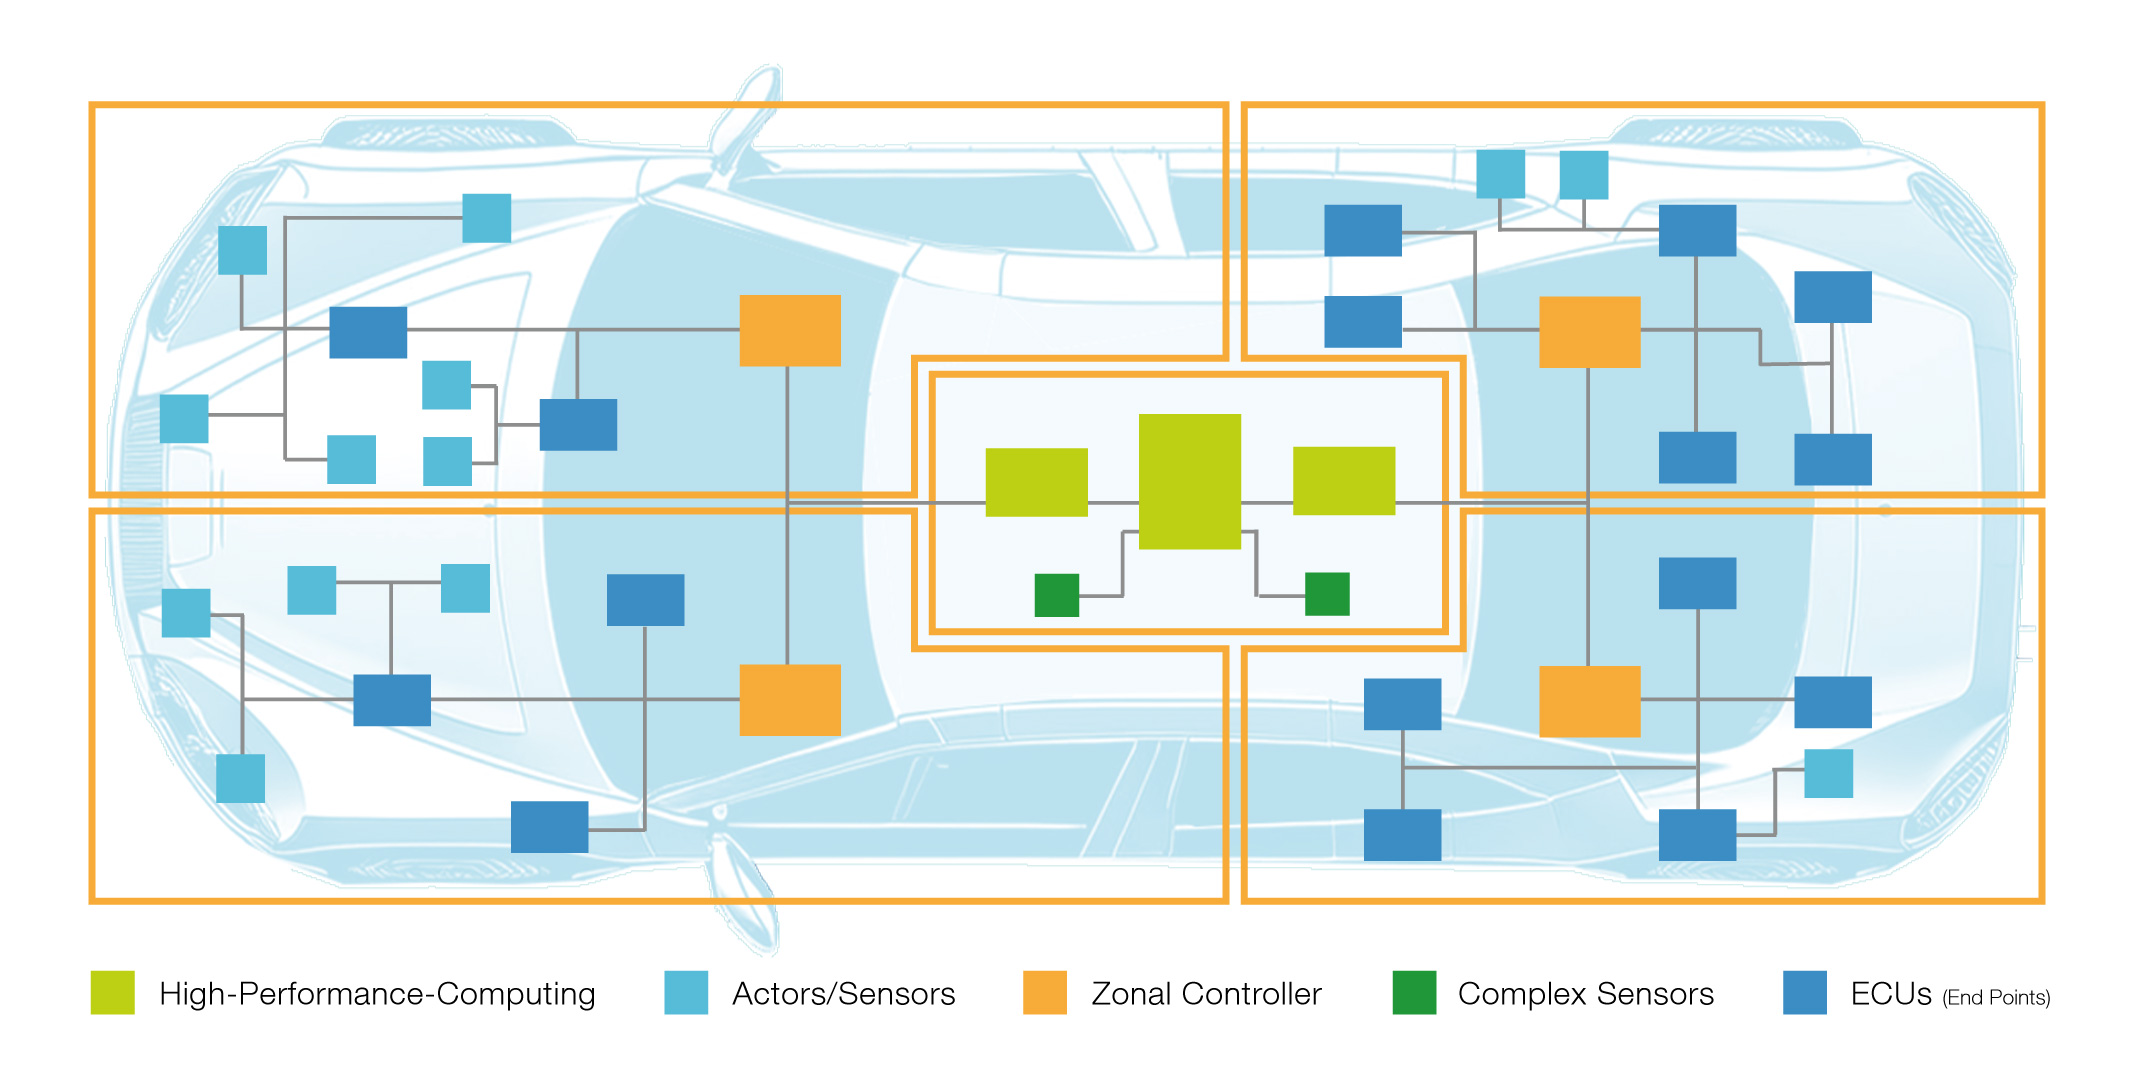
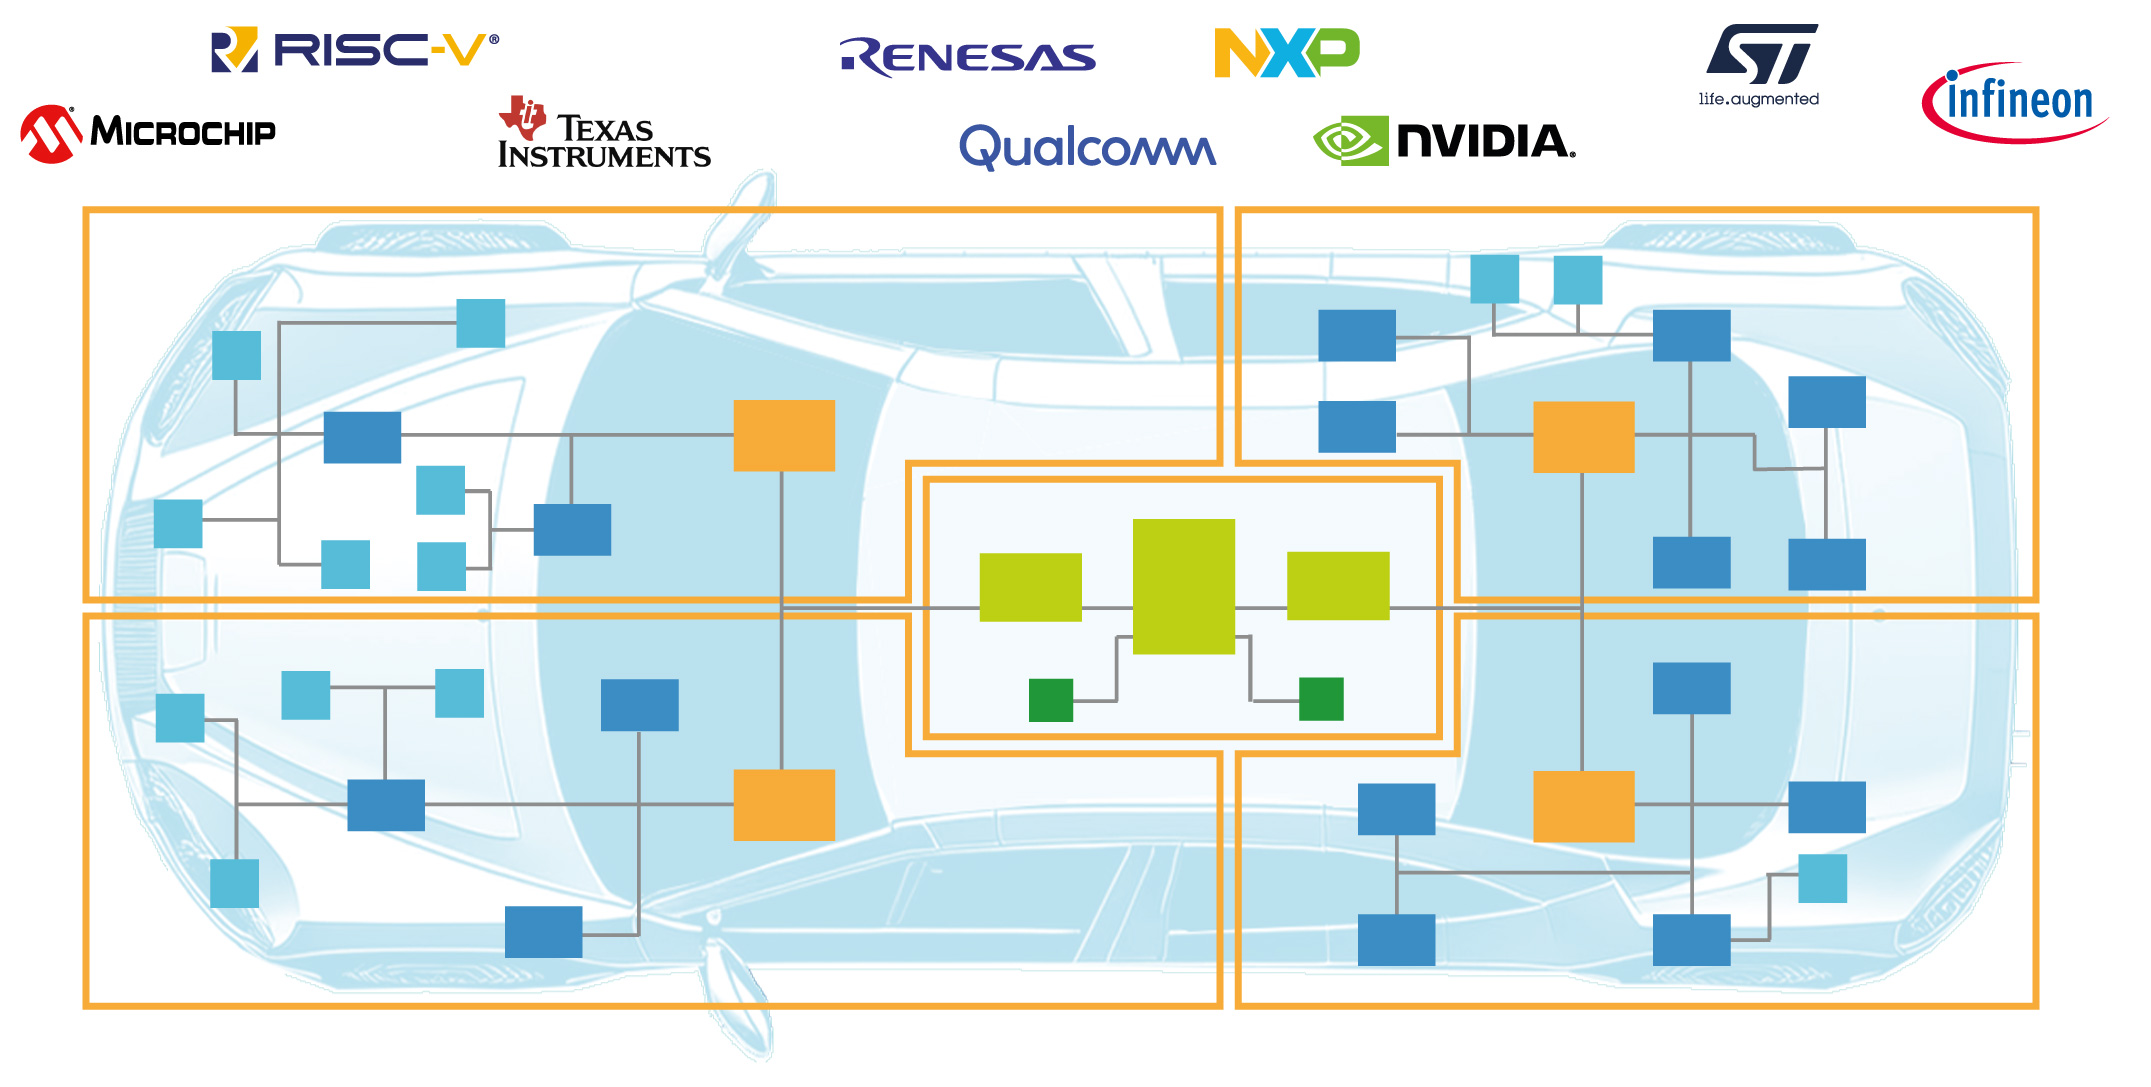
High Performance SoC for central vehicle controller applications.
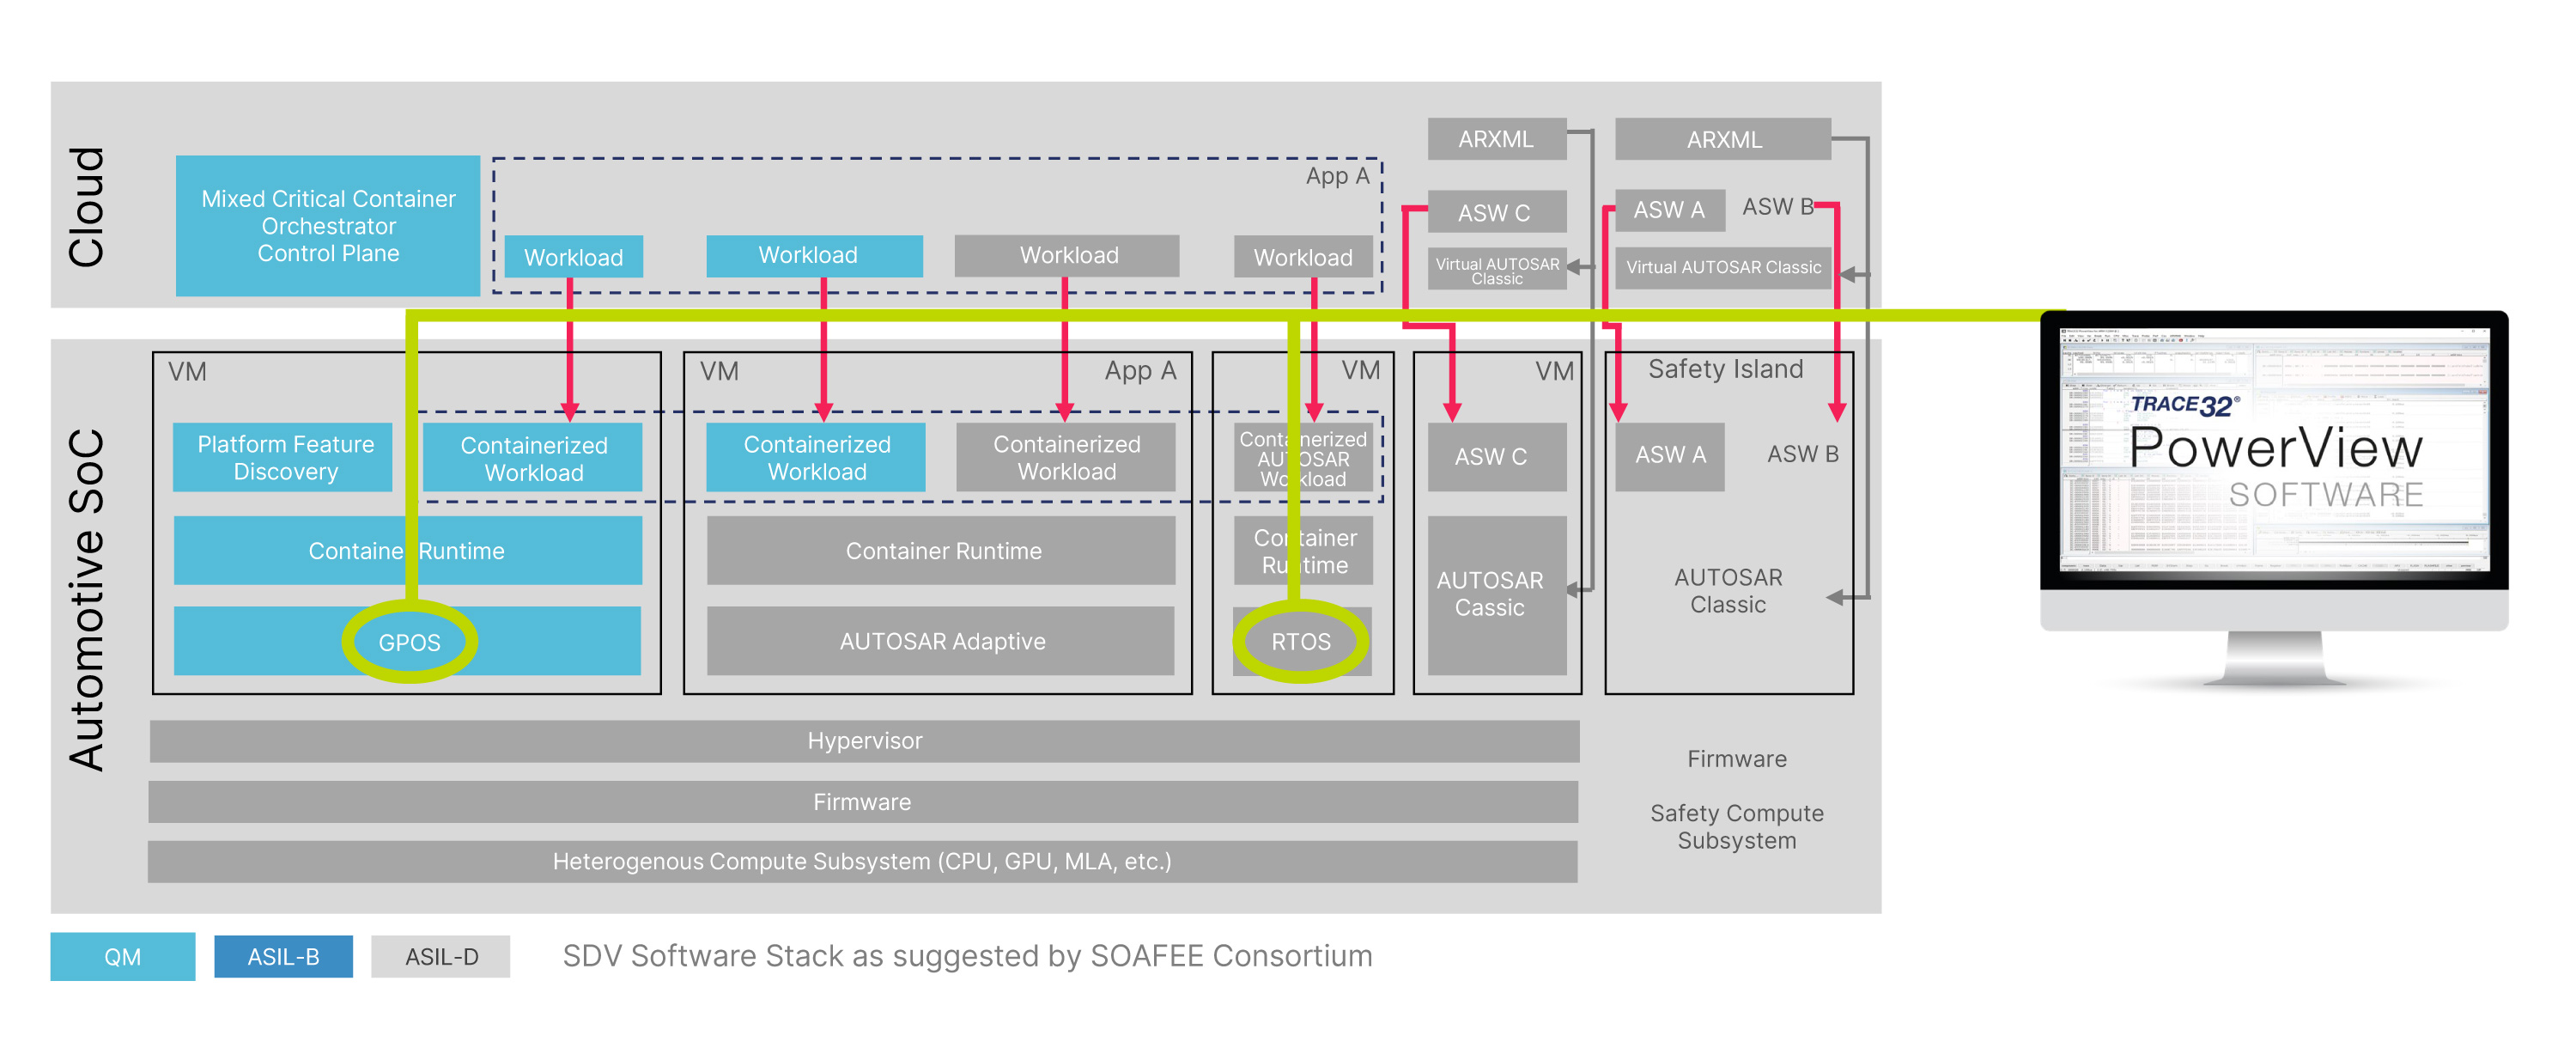
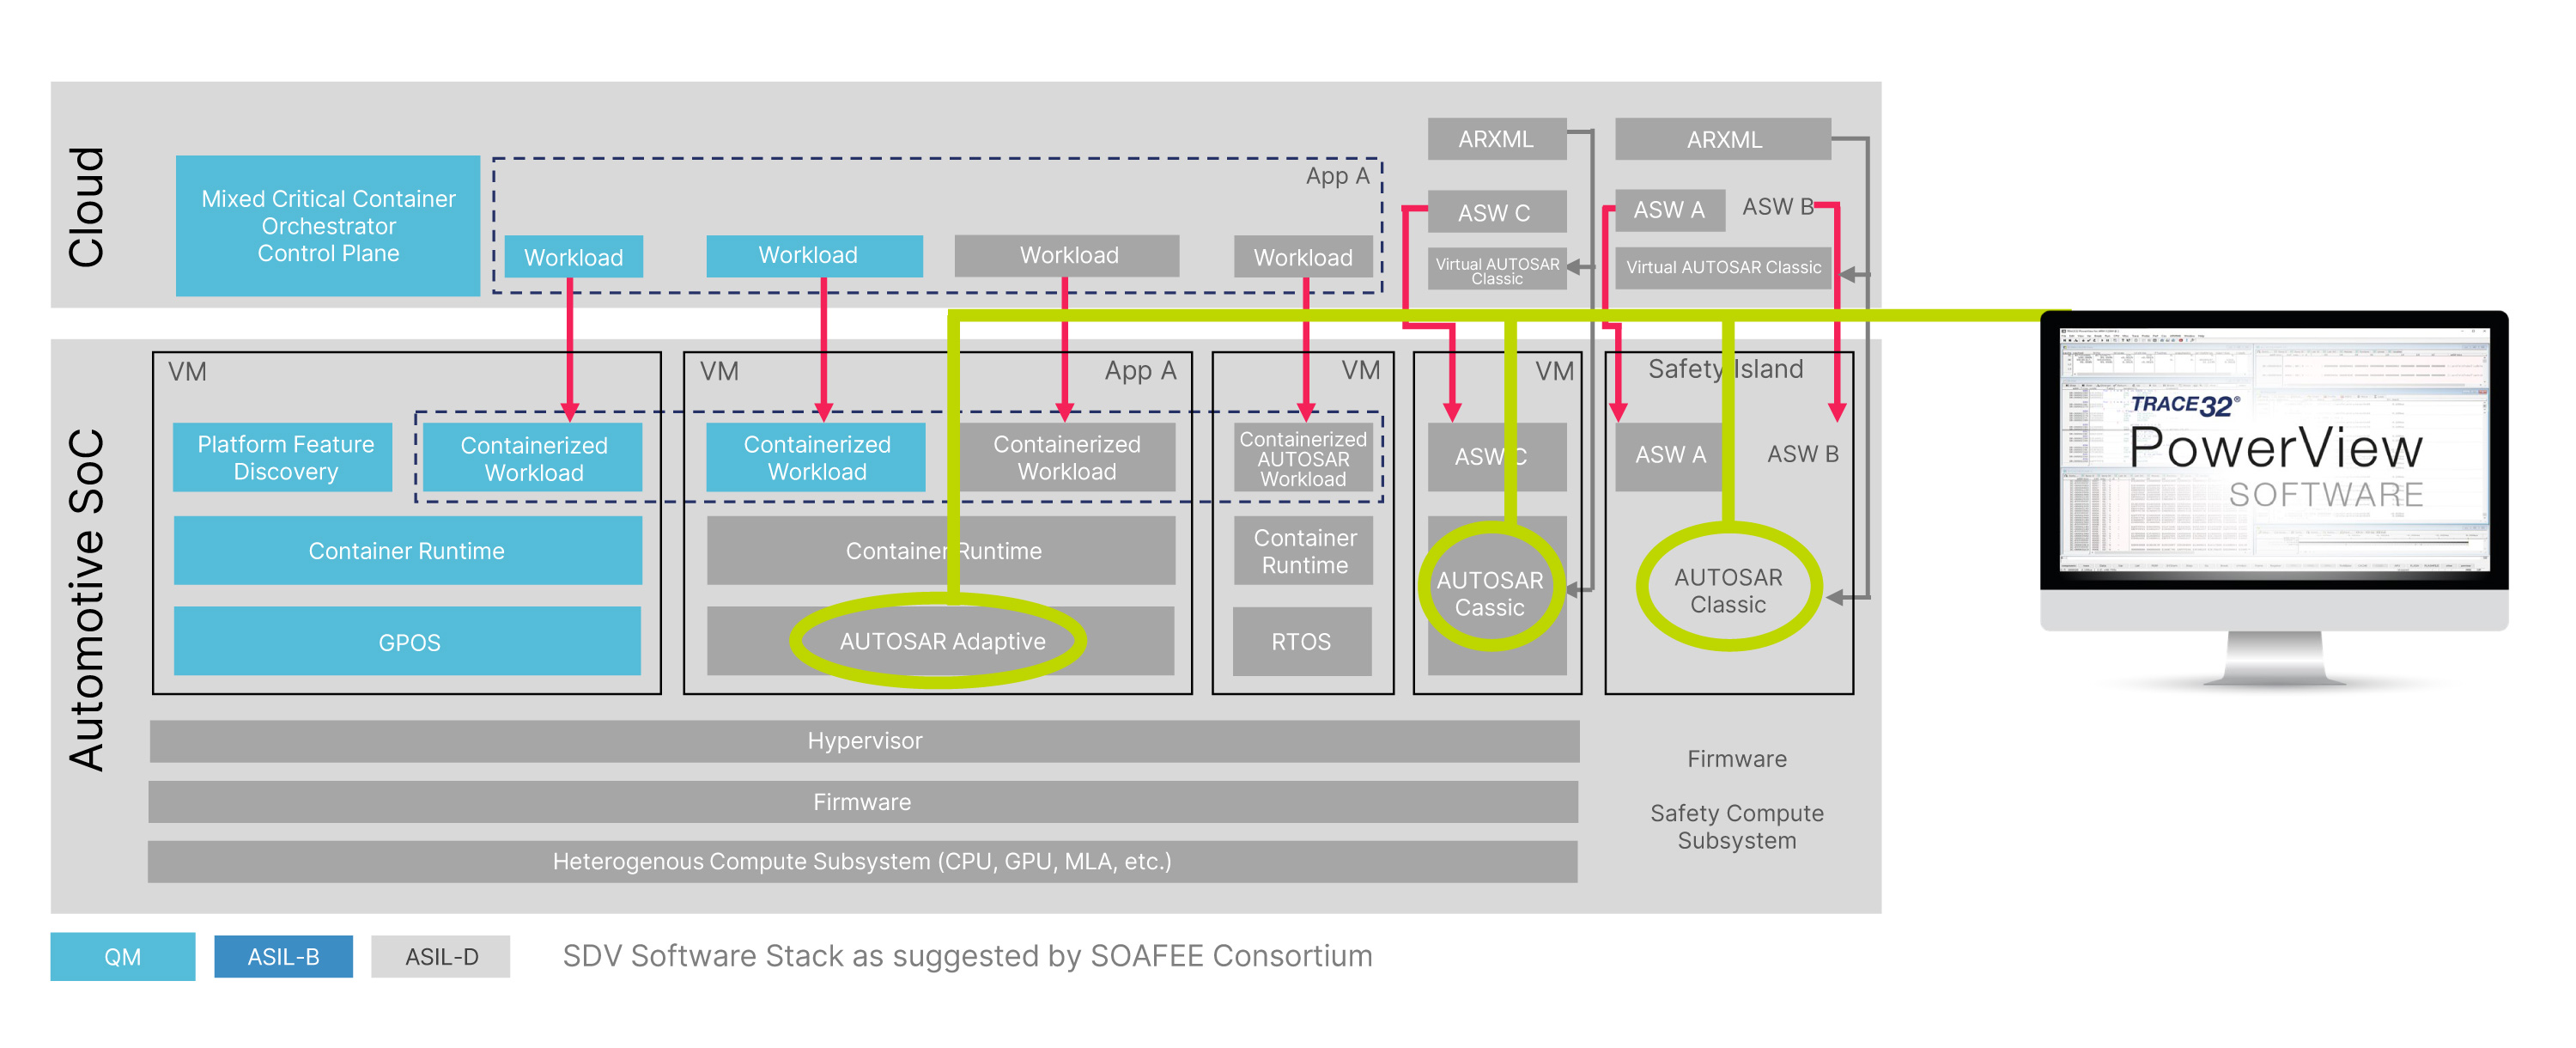
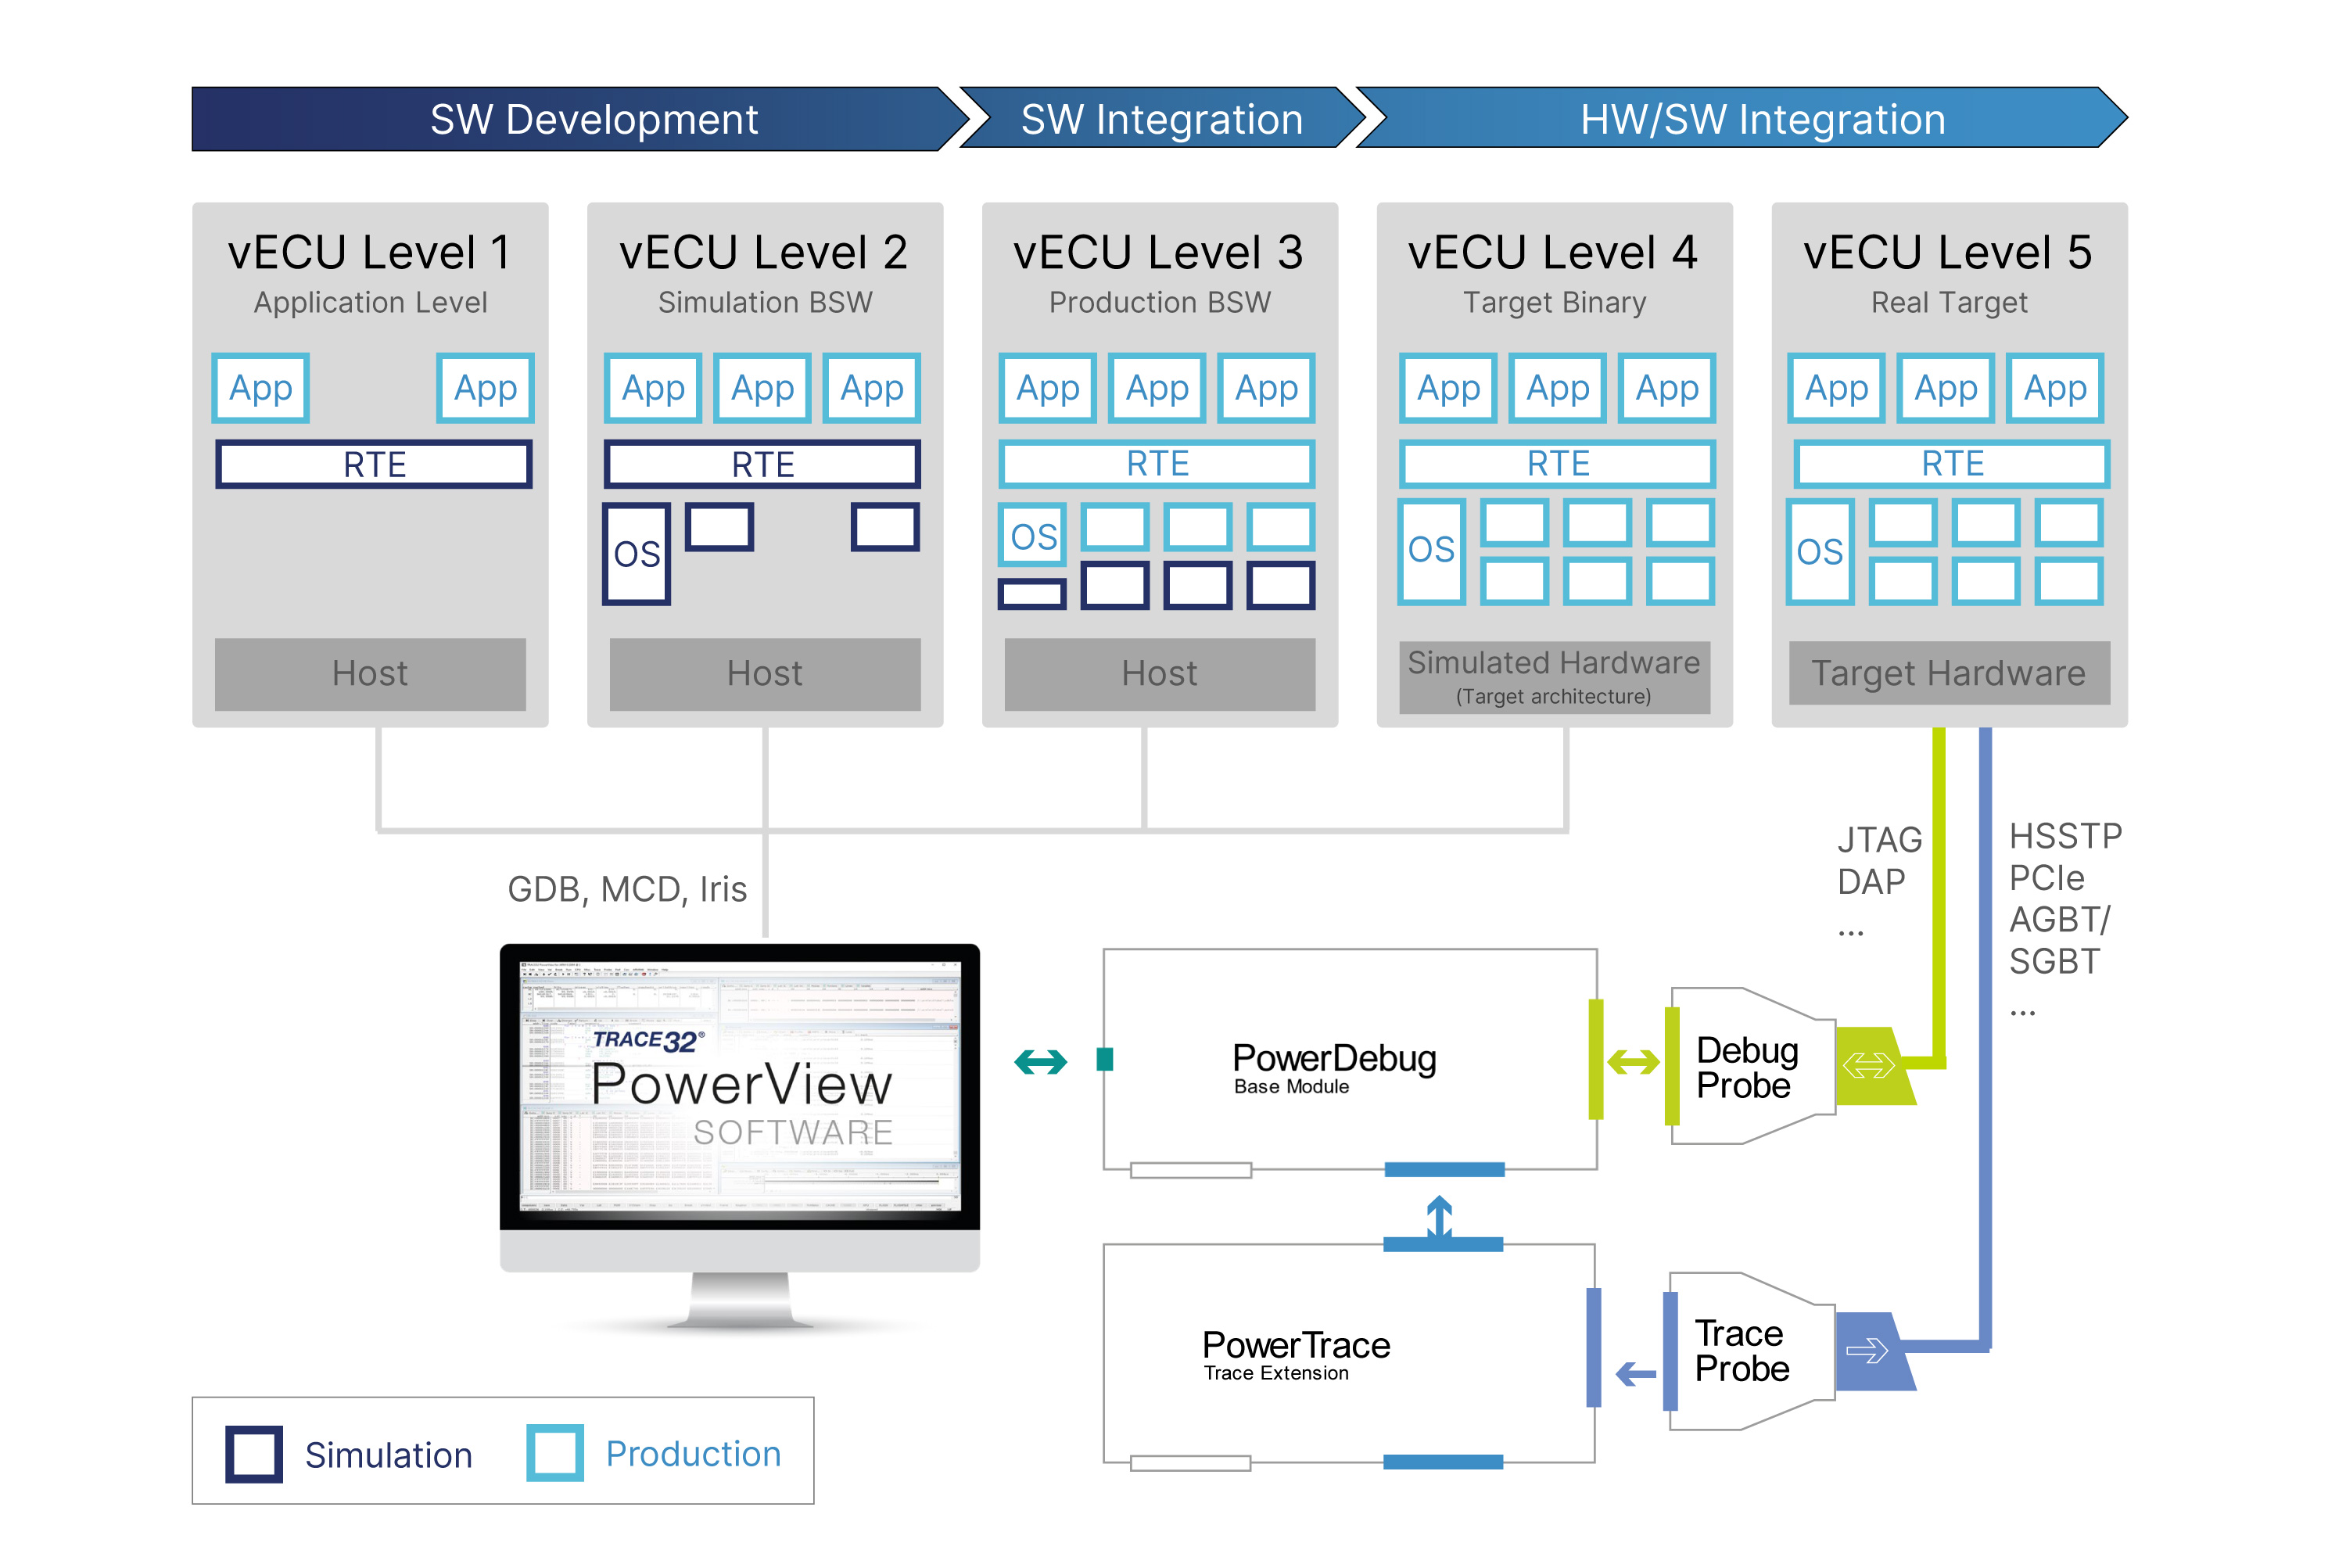
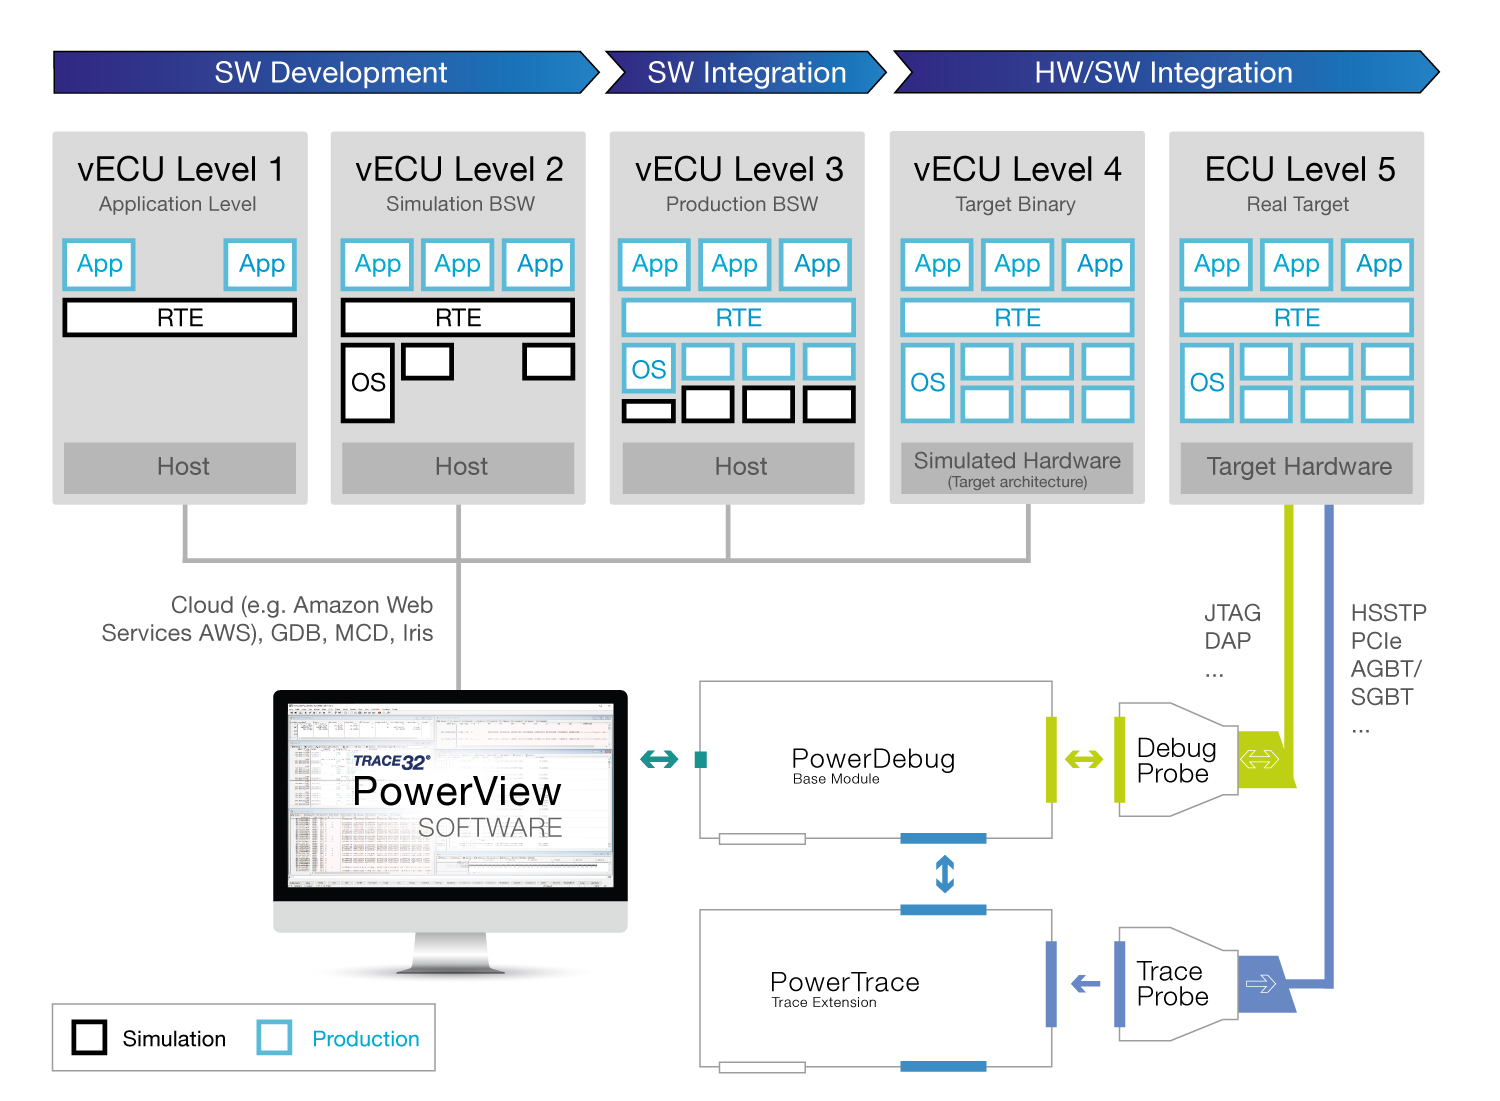
Our TRACE32® tools can debug all cores concurrently. You can trace the cores via parallel or serial Off-Chip-Trace or via On-Chip-Buffers.
Find Your Solution for S32N55